


Install NSCA
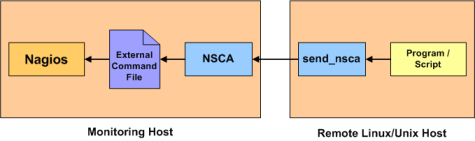
1 原理圖
NSCA
NSCA is an addon that allows you to send passive check results from remote Linux/Unix hosts to the Nagios Core daemon running on
the monitoring server. This is very useful in distributed and redundant/failover monitoring setups.
The NSCA addon can be found on Nagios Exchange.
2 安裝
2.1 安裝nagios
參考 安裝nagios 4.4
2.2 安裝nsca
2.2.1 下載nsca
nsca-2.9.1.tar.gz
2.2.1 安裝server端nsca
2.2.1.1 解壓、安裝
tar -xzvf ./nsca-2.9.1.tar.gz
cd ./nsca-2.9.1
./configure
make all
1) 會在src目錄下生成兩個程序 nsca send_nsca(主程序)
2) sample-config中會有nsca.cfg與send_nsca.cfg(配置文件)
3) 當前目錄下會有一個init-script(啓動腳本)
複製主程序
cp src/nsca /usr/local/nagios/bin/
複製主配置文件
cp sample-config/nsca.cfg /usr/local/nagios/etc
修改屬組屬主
chown nagios.nagios /usr/local/nagios/bin/nsca
chown nagios.nagios /usr/local/nagios/etc/nsca.cfg
配置服務
cp init-script /etc/init.d/nsca
chmod a+x /etc/init.d/nsca
修改nsca配置文件
vi /usr/local/nagios/etc/nsca.cfg
aggregate_writes=1
max_packet_age=60
password=nsca0622
#此處和分佈式監控服務器密碼一致
修改nagios配置文件
vi /usr/local/nagios/etc/nagios.cfg
check_external_commands=1
配置nagios檢查擴展命令
accept_passive_service_checks=1
配置接受被動服務檢測的結果
accept_passive_host_checks=1
#配置接受被動主機檢測的結果
#
service_freshness_check_interval=600
host_freshness_check_interval=600
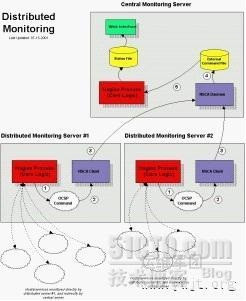
在分佈式中心服務器需要配置啓用外部事件處理、啓用被動檢測、自動轉換主機狀態爲軟狀態。以避免出現主機狀態頻繁切換造成的虛假報警。下面是Nagios配置文件中被動檢測相關配置節選部分。
passive_host_checks_are_soft=1
關閉主動監測
execute_host_checks=0
execute_service_checks=0
enable_flap_detection=0
驗證配置文件是否正確
/usr/local/nagios/bin/nagios -v /usr/local/nagios/etc/nagios.cfg
Things look okay - No serious problems were detected during the pre-flight check
啓動nagios和nsca服務
systemctl restart nagios.service
systemctl restart nsca.service
systemctl enable nagios.service
systemctl enable nsca.service
2.2.1.2 配置host service command
host
vi /usr/local/nagios/etc/objects/templates.cfg
This is NOT a real host, just a template!
define host {
name generic-host ; The name of this host template
notifications_enabled 1 ; Host notifications are enabled
event_handler_enabled 1 ; Host event handler is enabled
flap_detection_enabled 1 ; Flap detection is enabled
process_perf_data 1 ; Process performance data
retain_status_information 1 ; Retain status information across program restarts
retain_nonstatus_information 1 ; Retain non-status information across program restarts
notification_period 24x7 ; Send host notifications at any time
register 0 ; DON'T REGISTER THIS DEFINITION - ITS NOT A REAL HOST, JUST A TEMPLATE!
action_url /pnp4nagios/index.php/graph?host=$HOSTNAME$&srv=HOST
check_freshness 1
freshness_threshold 600
passive_checks_enabled 1
active_checks_enabled 0
check_command check_dummy!0
}
service
This is NOT a real service, just a template!
define service {
name generic-service ; The 'name' of this service template
active_checks_enabled 1 ; Active service checks are enabled
passive_checks_enabled 1 ; Passive service checks are enabled/accepted
parallelize_check 1 ; Active service checks should be parallelized (disabling this can lead to major performance problems)
obsess_over_service 1 ; We should obsess over this service (if necessary)
check_freshness 0 ; Default is to NOT check service 'freshness'
notifications_enabled 1 ; Service notifications are enabled
event_handler_enabled 1 ; Service event handler is enabled
flap_detection_enabled 1 ; Flap detection is enabled
process_perf_data 1 ; Process performance data
retain_status_information 1 ; Retain status information across program restarts
retain_nonstatus_information 1 ; Retain non-status information across program restarts
is_volatile 0 ; The service is not volatile
check_period 24x7 ; The service can be checked at any time of the day
max_check_attempts 3 ; Re-check the service up to 3 times in order to determine its final (hard) state
check_interval 10 ; Check the service every 10 minutes under normal conditions
retry_interval 2 ; Re-check the service every two minutes until a hard state can be determined
contact_groups admins ; Notifications get sent out to everyone in the 'admins' group
notification_options w,u,c,r ; Send notifications about warning, unknown, critical, and recovery events
notification_interval 60 ; Re-notify about service problems every hour
notification_period 24x7 ; Notifications can be sent out at any time
register 0 ; DON'T REGISTER THIS DEFINITION - ITS NOT A REAL SERVICE, JUST A TEMPLATE!
action_url /pnp4nagios/index.php/graph?host=$HOSTNAME$&srv=$SERVICEDESC$
check_command check_dummy!0
check_freshness 1
freshness_threshold 600
active_checks_enabled 0
}
command
vi /usr/local/nagios/etc/objects/commands.cfg
define command{
command_name service-is-stale
command_line $USER1$/staleservice.sh
}
define command{
command_name check_dummy
command_line $USER1$/check_dummy $ARG1$
}
配置staleservice.sh 腳本
vi /usr/local/nagios/libexec/staleservice.sh
#!/bin/sh
/bin/echo "CRITICAL: Service results are stale!"
exit 2
chmod a+x /usr/local/nagios/libexec/staleservice.sh
chown nagios:nagios /usr/local/nagios/libexec/staleservice.sh
2.2.2 安裝client端nsca(分佈式服務器)
2.2.2.1 編譯
編譯同server方法一樣
tar -xzvf ./nsca-2.9.1.tar.gz
cd ./nsca-2.9.1
./configure
make all
1)會在src目錄下生成兩個程序 nsca send_nsca(主程序)
2)sample-config中會有nsca.cfg與send_nsca.cfg(配置文件)
複製命令
cp src/send_nsca /usr/local/nagios/bin/
複製配置文件
cp sample-config/send_nsca.cfg /usr/local/nagios/etc/
修改屬組屬主
chown nagios.nagios /usr/local/nagios/bin/send_nsca
chown nagios.nagios /usr/local/nagios/etc/send_nsca.cfg
2.2.2.2 修改配置信息
修改配置 /usr/local/nagios/etc/send_nsca.cfg
vi /usr/local/nagios/etc/send_nsca.cfg
password=nsca0622 #此處和中心服務器密碼一致
在分佈式服務器的對象配置文件裏只定義那些由它直接監控的主機與服務的對象(與中心服務器定義監控主機和服務對象一致);
修改nagios配置文件
vi /usr/local/nagios/etc/nagios.cfg
enable_notifications=0 # 阻止它直接送出任何通知信息
obsess_over_services=1 # 配置爲強迫型服務(obsess over services)類型
ocsp_command=submit_service_check_result #定義一個強迫型服務處理(ocsp)命令
obsess_over_hosts=1 # 配置爲強迫型主機(obsess over hosts)類型
ochp_command=submit_host_check_result #定義一個強迫型主機處理(ochp)命令
定義command
vi /usr/local/nagios/etc/objects/commands.cfg
submit_service_check_result
define command{
command_name submit_service_check_result
command_line /usr/local/nagios/libexec/eventhandlers/submit_service_check_result $HOSTNAME$ '$SERVICEDESC$' $SERVICESTATE$ '$SERVICEOUTPUT$ |$SERVICEPERFDATA$'
}
submit_host_check_result
define command{
command_name submit_host_check_result
command_line /usr/local/nagios/libexec/eventhandlers/submit_host_result $HOSTNAME$ $HOSTSTATE$ '$HOSTOUTPUT$ |$HOSTPERFDATA$'
}
編輯
submit_host_check_result
submit_service_check_result
su - nagios
mkdir /usr/local/nagios/libexec/eventhandlers
cd /usr/local/nagios/libexec/eventhandlers
vi ./submit_service_check_result
#!/bin/sh
Arguments:
$1 = host_name (Short name of host that the service is
associated with)
$2 = svc_description (Description of the service)
$3 = state_string (A string representing the status of
the given service - "OK", "WARNING", "CRITICAL"
or "UNKNOWN")
$4 = plugin_output (A text string that should be used
as the plugin output for the service checks)
Convert the state string to the corresponding return code
PATH="/usr/local/sbin:/usr/local/bin:/sbin:/bin:/usr/sbin:/usr/bin"
export PATH
PROGNAME=$(basename "$0")
PROGPATH=$(echo "$0" | sed -e 's,[\/][^\/][^\/]*$,,')
REVISION="2.2.1"
PATH="/usr/local/sbin:/usr/local/bin:/sbin:/bin:/usr/sbin:/usr/bin"
. "$PROGPATH"/../utils.sh
central_server=9.1.9.90
return_code=-1
#echo "1:"$1 >>/tmp/nsca_c.log
#echo "2:"$2 >>/tmp/nsca_c.log
#echo "3:"$3 >>/tmp/nsca_c.log
#echo "4:"$4 >>/tmp/nsca_c.log
case "$3" in
OK)
return_code=$STATE_OK
;;
WARNING)
return_code=$STATE_WARNING
;;
CRITICAL)
return_code=$STATE_CRITICAL
;;
UNKNOWN)
return_code=$STATE_UNKNOWN
;;
esac
pipe the service check info into the send_nsca program, which
in turn transmits the data to the nsca daemon on the central
monitoring server
/usr/bin/printf "%s\t%s\t%s\t%s\n" "$1" "$2" "$return_code" "$4" | /usr/local/nagios/bin/send_nsca -H $central_server -c /usr/local/nagios/etc/send_nsca.cfg
/usr/bin/printf "%s\t%s\t%s\t%s\n" "$1" "$2" "$return_code" "$4" >>/tmp/nsca_c.log
chmod a+x ./submit_service_check_result
vi ./submit_host_result
#!/bin/sh
Arguments:
= host_name (Short name of host that the service is
associated with)
= svc_description (Description of the service)
= state_string (A string representing the status of
the given service - "OK", "WARNING", "CRITICAL"
or "UNKNOWN")
= plugin_output (A text string that should be used
as the plugin output for the service checks)
#
Convert the state string to the corresponding return code
central_server=9.1.9.90
return_code=-1
case "$2" in
UP)
return_code=0
;;
DOWN)
return_code=1
;;
UNREACHABLE)
return_code=2
;;
esac
pipe the service check info into the send_nsca program, which
in turn transmits the data to the nsca daemon on the central
monitoring server
/usr/bin/printf "%s\t%s\t%s\n" "$1" "$return_code" "$3" | /usr/local/nagios/bin/send_nsca -H $central_server -c /usr/local/nagios/etc/send_nsca.cfg
/usr/bin/printf "%s\t%s\t%s\n" "$1" "$return_code" "$3" >>/tmp/nsca_c_h.log
chmod a+x ./submit_host_result
檢查nagios配置,並重啓
/usr/local/nagios/bin/nagios -v /usr/local/nagios/etc/nagios.cfg
systemctl restart nagios.service
systemctl enable nagios.service
注意點:
1、中心服務器和分佈式服務器的時間一定要調整一致
2、分佈式服務器監控客戶端主機可以用任何方式,主動被動都可以
3、分佈式上定義的監控主機與服務,在中心服務器上也要定義,保證主機名(host_name)和服務描述(service_description)一致。
4、分佈式服務器上定義的服務檢測命令(check_command)是真正的檢測服務的命令 ,中心服務器上定義的服務檢測命令(check_command)是當中心服務器由被動檢測變爲主動檢測時執行的命令(也就是當分佈式主機不發送檢測命令時中心服務器執行的命令),正常情況下不執行這個命令。