


Prometheus and Alertmanager

Download binary and Docker-image
How to get metrics from target jobs
- timeseries collection happens via a pull model over HTTP
- pushing timeseries is supported via an intermediary gateway
- targets are discovered via service discovery or static configuration
How to run prometheus by docker container?
Attrations of the volume dir privileges in higher version prometheus. because the base image that use to build prom/prometheus images is changed.
see details from dockerfile in hub.docker.com. as below.
FROM        quay.io/prometheus/busybox:latest
MAINTAINER  The Prometheus Authors <[email protected]>

COPY prometheus                             /bin/prometheus
COPY promtool                               /bin/promtool
COPY documentation/examples/prometheus.yml  /etc/prometheus/prometheus.yml
COPY console_libraries/                     /etc/prometheus/
COPY consoles/                              /etc/prometheus/

EXPOSE     9090
VOLUME     [ "/prometheus" ]
WORKDIR    /prometheus
ENTRYPOINT [ "/bin/prometheus" ]
CMD        [ "-config.file=/etc/prometheus/prometheus.yml", \
             "-storage.local.path=/prometheus", \
             "-web.console.libraries=/etc/prometheus/console_libraries", \
             "-web.console.templates=/etc/prometheus/consoles" ]
run prometheus v2.4 in docker container.
configure_file=/apps/prometheus/conf
prometheus_data=/data/prometheus
chown -R nobody:nogroup /data/prometheus
chown -R nonody:nogroup /apps/prometheus/conf
docker run -d --name prometheus --restart=always -v $(configure_file):/etc/prometheus/ -v $(prometheus_data):/prometheus -p 9090:9090 prom/prometheus:latest --config.file=/etc/prometheus/prometheus.yml
running alertmanager
docker run -d --name alertmanager --restart=always -p 10.1.100.231:9093:9093 -v /apps/alertmanager:/etc/alertmanager -v /data/alertmanager:/alertmanager prom/alertmanager:latest --config.file=/etc/alertmanager/config.ymlHow to synchronize metric data between Prometheus server?
???
How apply new configuration files?
- send SIGHUP
- send http post request to
/-/reloadendpoint
How to specifies a set of targets by static_configs or dynamically discovered?
expression
All regular expressions in prometheus use RE2 syntax
How to upgrade prometheus server version?
Attentions
- prometheus commandline args is different for different prometheus version.
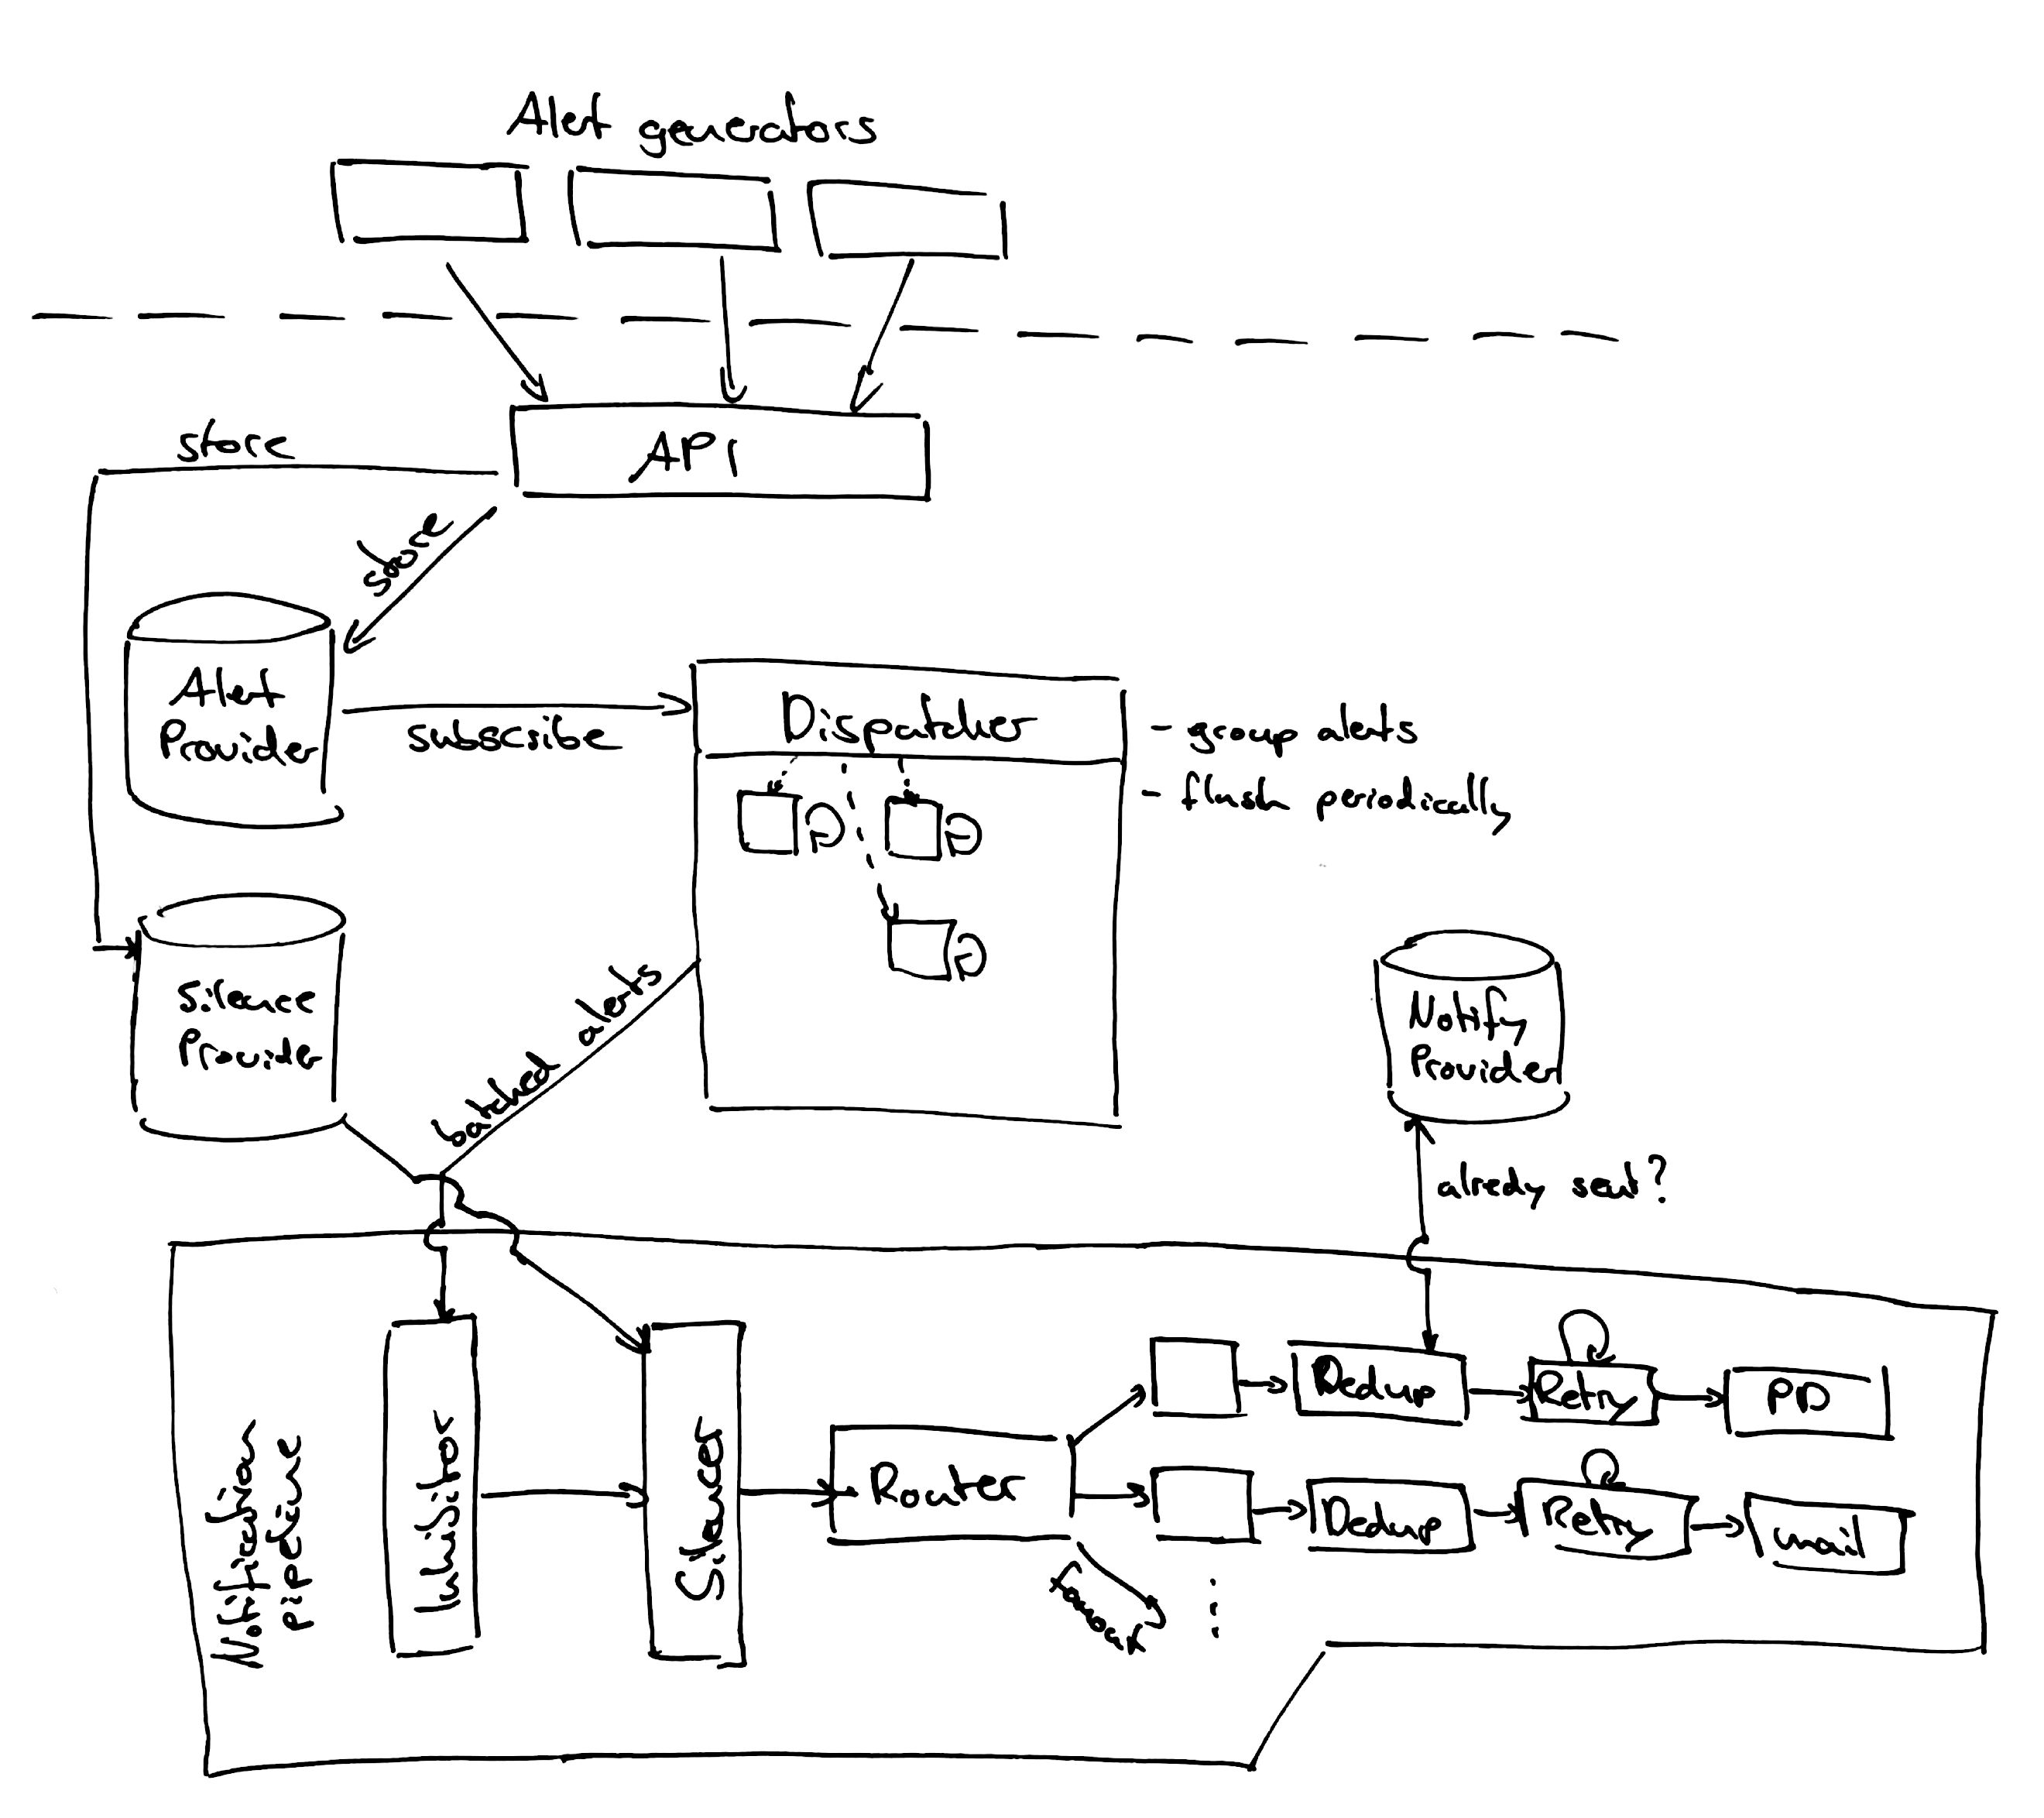
使用prometheus告警時,prometheus會把警告規則發送給AlertManager,然後再由AlertManager管理這些警告,Alertmanager發送通知的方式通常有以下幾種:
- PagerDuty
- webhook
- Slack
- OpsGenie
設置警報與通知的步驟
- 設置並配置 Alertmanager
- 配置Prometheus與Alertmanager的api接口
- 在prometheus中創建警報規則
prometheus的優勢
- 引用一篇cloudman的文章,Prometheus到底NB在哪裏?
Alertmanager的配置
Alertmanager通過命令行參數和配置文件進行配置,命令行參數進行的配置是固定的,配置文件定義了路由通知,通知接受者的信息
使用可視化編輯器可以幫助你構建路由樹
使用alertmanager -h顯示alertmanager可用的命令行參數
Alertmanager可以在進程運行的時候重新加載他的配置文件,如果你的配置文件不正確,它將不會被記錄以及應用,只有你對正在運行的進程發送SIGHUP信號或者通過發送HTTP POST請求到/-/reload時纔會被加載
路由塊定義路由樹中的節點及其子節點。如果未設置,其可選配置參數將從其父節點繼承。每個警報都在配置的頂級路由中進入路由樹,該路由必須匹配所有警報(即沒有任何已配置的匹配器)。然後它遍歷子節點。如果將continue設置爲false,則在第一個匹配的子項後停止。如果匹配節點上的continue爲true,則警報將繼續與後續兄弟節點匹配。如果警報與節點的任何子節點都不匹配(沒有匹配的子節點,或者不存在),則根據當前節點的配置參數處理警報。
# The root route with all parameters, which are inherited by the child
# routes if they are not overwritten.
route:
  receiver: 'default-receiver'
  group_wait: 30s
  group_interval: 5m
  repeat_interval: 4h
  group_by: [cluster, alertname]
  # All alerts that do not match the following child routes
  # will remain at the root node and be dispatched to 'default-receiver'.
  routes:
  # All alerts with service=mysql or service=cassandra
  # are dispatched to the database pager.
  - receiver: 'database-pager'
    group_wait: 10s
    match_re:
      service: mysql|cassandra
  # All alerts with the team=frontend label match this sub-route.
  # They are grouped by product and environment rather than cluster
  # and alertname.
  - receiver: 'frontend-pager'
    group_by: [product, environment]
    match:
team: frontend一些receiver的常見配置:https://prometheus.io/docs/alerting/configuration/
- slack
- webhook
- pagerduty
免責聲明:Prometheus會自動負責發送由其配置的警報規則生成的警報。強烈建議根據時間序列數據在Prometheus中配置警報規則,而不是實現直接客戶端
通知模板
prometheus向alertmanager發送警告.alertManager向接受者發送通知的模板是可以自定義的,也可以使用Prometheus自身的模板,其自身的模板是基於Go語言的
prometheus query express
prometheus query function rate() vs irate()?
- rate() 某個時間時間範圍內每秒的增長率,rate應該只和計數器一起使用。最適合告警和緩慢計數器的繪圖
- irate() 某個時間範圍內某個時刻的每秒增長率,基於最後兩個數據點進行計算。自適應單調性中斷(比如target重啓導致的計數器重置)
# 最後五分鐘http請求增長率
rate(http_requests_total{job="api-server"}[5m])
# 返回五分鐘內最近兩次數據點的HTTP請求每秒增長率
irate(http_requests_total{job="api-server"}[5m])
HTTP API
reload promether configuration file
http://192.168.20.161:9090/-/reload