


第2節( 跟我學Spring Cloud(Finchley版)-02-構建分佈式應用 )說過:
應用沒有監控,沒有畫板,一切指標都沒有。在這個Growth Hack逐漸成爲主流的時代,不弄個Dashboard把系統壓力、QPS、CPU、內存、日活啥的可視化,你好意思出來混嗎……
本節我們來解決該問題。
Spring Boot Actuator是Spring Boot官方提供的監控組件。只需爲項目添加以下依賴,即可就整合Spring Boot Actuator。
<dependency>
  <groupId>org.springframework.boot</groupId>
  <artifactId>spring-boot-starter-actuator</artifactId>
</dependency>
監控端點
Actuator爲我們提供了很多監控端點,如下表所示。
| 端點(Spring Boot 2.x) | 描述 | HTTP方法 | 是否敏感 | 端點(Spring Boot 1.x) |
|---|---|---|---|---|
| conditions | 顯示自動配置的信息 | GET | 是 | autoconfig |
| beans | 顯示應用程序上下文所有的Spring bean | GET | 是 | beans |
| configprops | 顯示所有@ConfigurationProperties的配置屬性列表 | GET | 是 | configprops |
| dump | 顯示線程活動的快照 | GET | 是 | dump |
| env | 顯示環境變量,包括系統環境變量以及應用環境變量 | GET | 是 | env |
| health | 顯示應用程序的健康指標,值由HealthIndicator的實現類提供;結果有UP、 DOWN、OUT_OF_SERVICE、UNKNOWN;如需查看詳情,需配置:management.endpoint.health.show-details |
GET | 否 | health |
| info | 顯示應用的信息,可使用info.* 屬性自定義info端點公開的數據 |
GET | 否 | info |
| mappings | 顯示所有的URL路徑 | GET | 是 | mappings |
| metrics | 顯示應用的度量標準信息 | GET | 是 | metrics |
表-Spring Boot Actuator常用端點及描述
只需訪問http://{ip}:{port}/actuator/{endpoint} 端點,即可監控應用的運行狀況。
測試1:/health端點
爲前文編寫的microservice-simple-provider-user 服務整合Actuator後,我們來做一些測試:
訪問<http://localhost:8000/actuator/health> ,即可獲得如下結果:
{"status":"UP"}測試2:/health端點展示詳情
爲/health 端點配置顯示詳情:
management:
  endpoint:
    health:
      # 是否展示健康檢查詳情
show-details: always再次訪問<http://localhost:8000/actuator/health> ,即可獲得如下結果:
{
    "status": "UP",
    "details": {
        "db": {
            "status": "UP",
            "details": {
                "database": "H2",
                "hello": 1
            }
        },
        "diskSpace": {
            "status": "UP",
            "details": {
                "total": 250790436864,
                "free": 43443773440,
                "threshold": 10485760
            }
        }
    }
}從中可以看到,/health 端點展示了DB的健康情況以及磁盤的健康情況。
測試3:暴露敏感路徑
默認情況下,敏感路徑並不暴露。如需暴露(以metrics爲例),需添加配置:
management:
  endpoints:
    web:
      exposure:
        # 暴露metrics端點,如需暴露多個,用,分隔;如需暴露所有端點,用'*'
include: metrics訪問:<http://localhost:8000/actuator/metrics> ,可獲得類似如下的結果:
{
    "names": ["jvm.memory.max", "http.server.requests", "jdbc.connections.active", "process.files.max", "jvm.gc.memory.promoted", "tomcat.cache.hit", "system.load.average.1m", "tomcat.cache.access", "jvm.memory.used", "jvm.gc.max.data.size", "jdbc.connections.max", "jdbc.connections.min", "jvm.gc.pause", "jvm.memory.committed", "system.cpu.count", "logback.events", "tomcat.global.sent", "jvm.buffer.memory.used", "tomcat.sessions.created", "jvm.threads.daemon", "system.cpu.usage", "jvm.gc.memory.allocated", "tomcat.global.request.max", "hikaricp.connections.idle", "hikaricp.connections.pending", "tomcat.global.request", "tomcat.sessions.expired", "hikaricp.connections", "jvm.threads.live", "jvm.threads.peak", "tomcat.global.received", "hikaricp.connections.active", "hikaricp.connections.creation", "process.uptime", "tomcat.sessions.rejected", "process.cpu.usage", "tomcat.threads.config.max", "jvm.classes.loaded", "hikaricp.connections.max", "hikaricp.connections.min", "jvm.classes.unloaded", "tomcat.global.error", "tomcat.sessions.active.current", "tomcat.sessions.alive.max", "jvm.gc.live.data.size", "tomcat.servlet.request.max", "hikaricp.connections.usage", "tomcat.threads.current", "tomcat.servlet.request", "hikaricp.connections.timeout", "process.files.open", "jvm.buffer.count", "jvm.buffer.total.capacity", "tomcat.sessions.active.max", "hikaricp.connections.acquire", "tomcat.threads.busy", "process.start.time", "tomcat.servlet.error"]
}訪問http://localhost:8000/actuator/metrics/{name} ,{name} 列表如上,即可查看當前應用的度量指標。例如訪問:<http://localhost:8000/actuator/metrics/jvm.memory.max> 即可查看JVM可管理的最大內存,結果類似如下:
{
    "name": "jvm.memory.max",
    "description": "The maximum amount of memory in bytes that can be used for memory management",
    "baseUnit": "bytes",
    "measurements": [{
        "statistic": "VALUE",
        "value": 5.597298687E9
    }],
    "availableTags": [{
        "tag": "area",
        "values": ["heap", "nonheap"]
    }, {
        "tag": "id",
        "values": ["Compressed Class Space", "PS Survivor Space", "PS Old Gen", "Metaspace", "PS Eden Space", "Code Cache"]
    }]
}
TIPS
-
如需暴露所有監控端點可配置:
management: endpoints: web: exposure: include: '*' - 有關Spring Boot 1.x與2.x端點的差異,詳見:<https://github.com/spring-projects/spring-boot/wiki/Spring-Boot-2.0-Migration-Guide#endpoints>
拓展閱讀
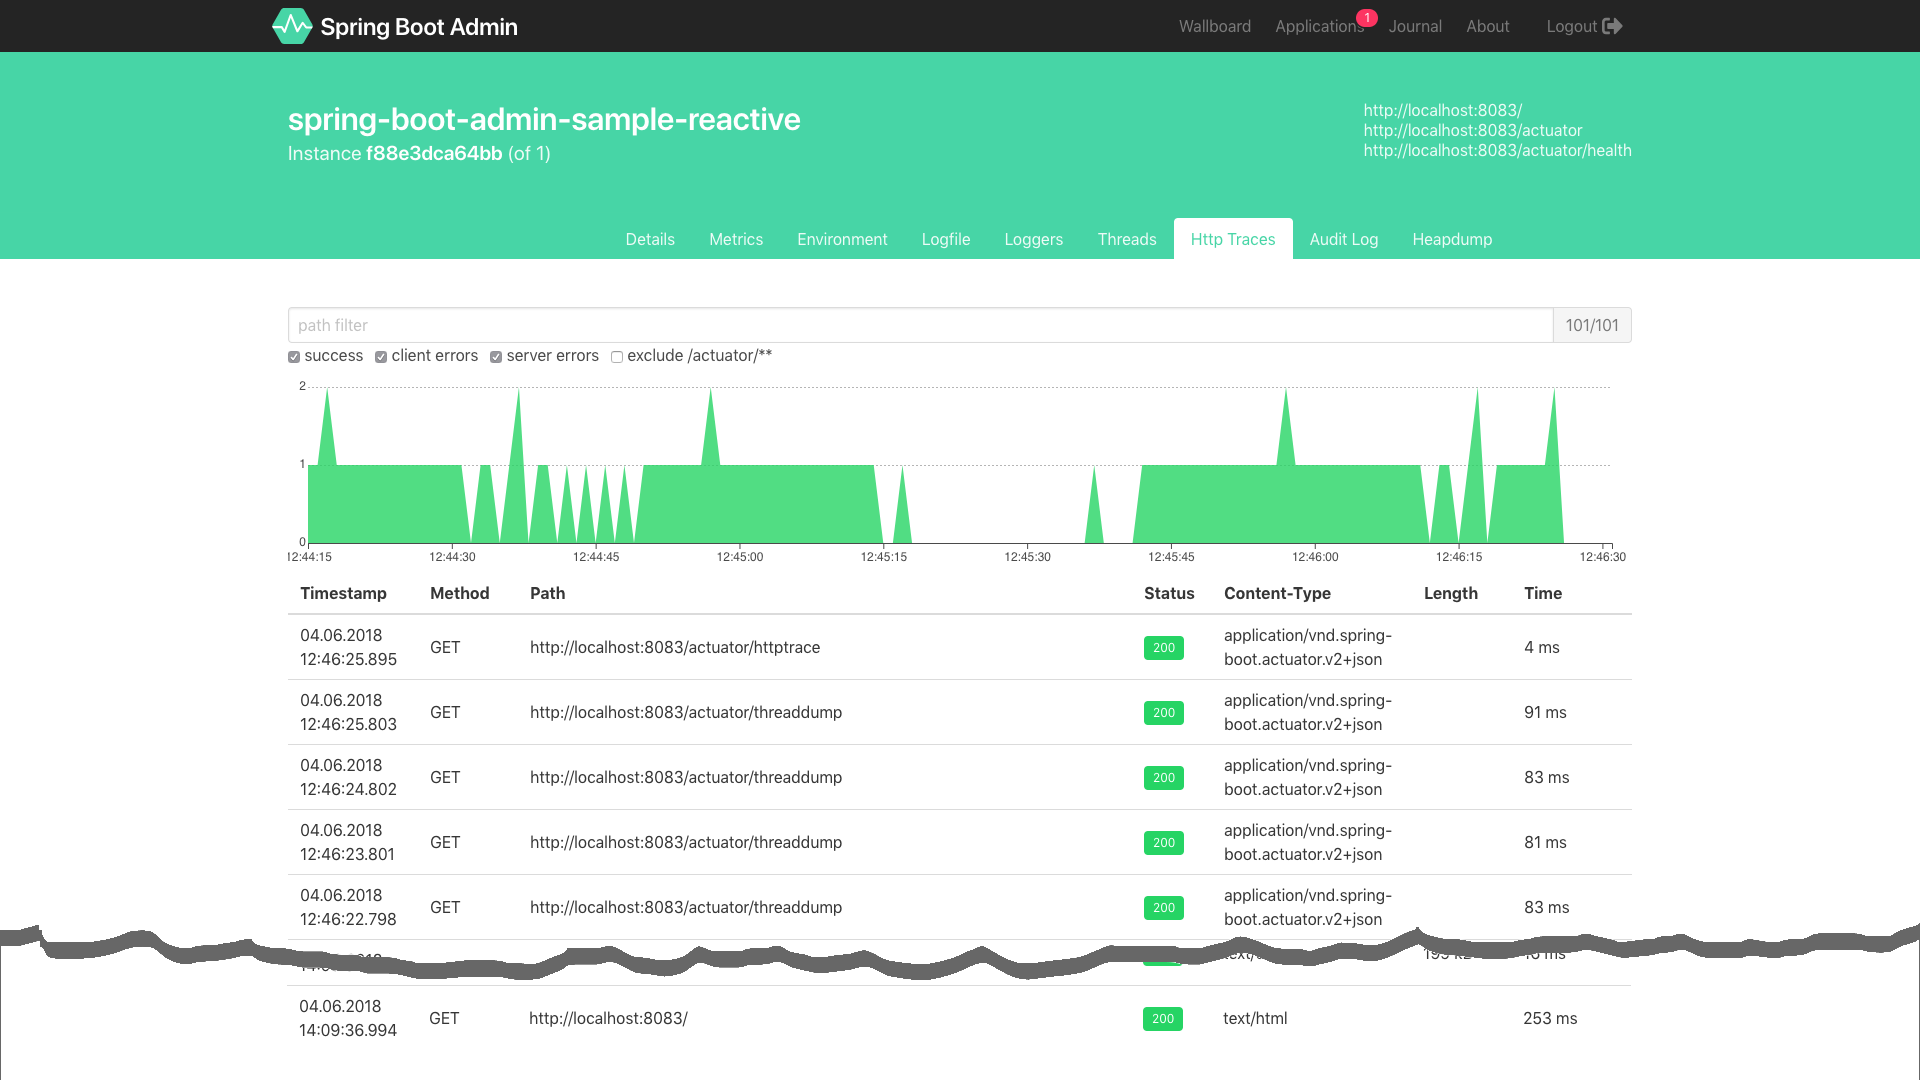
如果能對Actuator端點的文字數據進行圖形化的展示,我們就可以實現比較低層次的“Growth Hack”啦!開源界已經有這樣的工具——Spring Boot Admin ,界面如下。有興趣的可前往<https://github.com/codecentric/spring-boot-admin>瞭解。
說明
- 由於Actuator本身是Spring Boot中的組件,並不是本套教程的重點(其實筆者本不想寫這一節,但後面又會持續用這些端點,並且Spring Cloud在這些端點的基礎上還做了一些增加,所以還是有必要介紹一下),因此本節只是對Actuator進行了比較簡單的介紹,讀者可自行挖掘Actuator的其他能力。也可持續關注本公衆號,本系列完成後,筆者將會扒開Actuator的底褲,深度介紹Spring Boot監控的那些事兒。
配套代碼
GitHub:
- https://github.com/eacdy/spring-cloud-study/tree/master/2018-Finchley/microservice-simple-provider-user
- https://github.com/eacdy/spring-cloud-study/tree/master/2018-Finchley/microservice-simple-consumer-movie
Gitee:
- https://gitee.com/itmuch/spring-cloud-study/tree/master/2018-Finchley/microservice-simple-provider-user
- https://gitee.com/itmuch/spring-cloud-study/tree/master/2018-Finchley/microservice-simple-consumer-movie
原文:http://www.itmuch.com/spring-cloud/finchley-3/ ,轉載請說明出處。
