簡述
WPF開發中經常需要繪製曲線、直方圖等。雖然WPF自帶了繪製圖形等基礎功能,但做程序一個很基礎的原則就是避免重複造輪子。在GitHub上找到了微軟官方的WPF繪製曲線開源庫:InteractiveDataDisplay.WPF。
我使用的IDE是VS201x,建議使用NuGet安裝--引用InteractiveDataDisplay.WPF。如何使用NuGet,請自行百度。
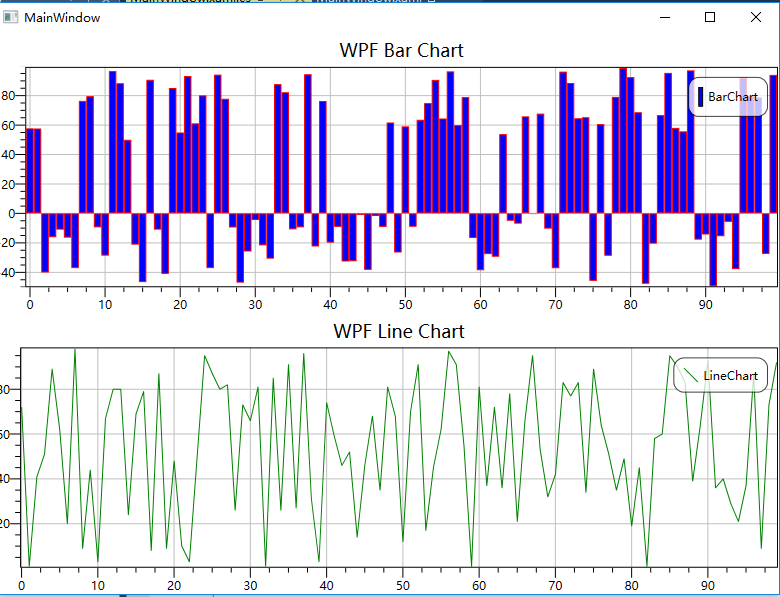
以下是我實驗的該開源庫繪製的WPF曲線程序。
代碼
MainWindow.xaml
<Window x:Class="WpfDrawPlot.MainWindow"
        xmlns="http://schemas.microsoft.com/winfx/2006/xaml/presentation"
        xmlns:x="http://schemas.microsoft.com/winfx/2006/xaml"
        xmlns:d3="clr-namespace:InteractiveDataDisplay.WPF;assembly=InteractiveDataDisplay.WPF"
        Title="MainWindow" Height="600" Width="800">
    <Grid>
        <Grid.RowDefinitions>
            <RowDefinition Height="*"/>
            <RowDefinition Height="*"/>
        </Grid.RowDefinitions>

        <!-- BarGraph -->
        <d3:Chart Grid.Row="0">
            <d3:Chart.Title>
                <TextBlock Text="WPF Bar Chart" HorizontalAlignment="Center" FontSize="18" Margin="0, 5"/>
            </d3:Chart.Title>
            <d3:BarGraph x:Name="BarChart" Description="BarChart" Stroke="Red" StrokeThickness="1"/>
        </d3:Chart>

        <!-- LineGraph -->
        <d3:Chart x:Name="LinePlot" Grid.Row="1">
            <d3:Chart.Title>
                <TextBlock Text="WPF Line Chart" HorizontalAlignment="Center" FontSize="18" Margin="0, 5"/>
            </d3:Chart.Title>
            <d3:LineGraph x:Name="LineChart" Description="LineChart" Stroke="Green" StrokeThickness="1"/>
        </d3:Chart>

    </Grid>
</Window>
MainWindow.cs
using System;
using System.Collections.Generic;
using System.Linq;
using System.Text;
using System.Threading.Tasks;
using System.Windows;
using System.Windows.Controls;
using System.Windows.Data;
using System.Windows.Documents;
using System.Windows.Input;
using System.Windows.Media;
using System.Windows.Media.Imaging;
using System.Windows.Navigation;
using System.Windows.Shapes;
using System.Threading;
using InteractiveDataDisplay.WPF;

namespace WpfDrawPlot
{
    /// <summary>
    /// MainWindow.xaml 的交互邏輯
    /// </summary>
    public partial class MainWindow : Window
    {
        public MainWindow()
        {
            InitializeComponent();

            //線程中更新曲線
            Thread threadTmp = new Thread( UpdateChart );
            threadTmp.Start();
        }

        private void UpdateChart()
        {
            int nPointNum = 100;
            Random randm = new Random();
            double[] dArray = new double[ nPointNum ];
            double[] dX = new double[ nPointNum ];
            double[] dY = new double[ nPointNum ];
            double dRandomtTmp = 0;

            while( true )
            {
                Thread.Sleep( 1000 );//每秒刷新一次
                for ( int n = 0; n < dArray.Length; n++ )
                {
                    dRandomtTmp = randm.NextDouble();
                    dArray[ n ] = ( dRandomtTmp < 0.5 ) ? -dRandomtTmp * dArray.Length : dRandomtTmp * dArray.Length;
                }
                for ( int n = 0; n < dX.Length; n++ )
                {
                    dX[ n ] = n;
                    dY[ n ] = randm.Next( dX.Length );
                }

                //更新UI
                Dispatcher.Invoke( new Action( delegate
                {
                    this.BarChart.PlotBars( dArray );
                    this.LineChart.Plot( dX, dY );
                } ) );
            }
        }
    }
}
效果