


1.上次進程可視化由svg實現,本次改用echarts框架實現。
Js文件:loadxmldoc.js(用於加載xml文檔)
echarts.js(用來實現有向圖繪製)
2.思路:
Echarts是定義數據對象數組data和連接對象數組links,數據對象數組即每個節點爲一個對象,每個對象有屬性位置x、y,名字name等屬性;連接對象數組即每條連線爲一個對象,內有屬性source原點及target目標點等。
上次由於未發現設置連線速度的方法,我採用了三個對象數組。其中兩個數據對象數組,一個爲實際進程節點,位置固定;另一個爲移動節點,x、y根據進程的運行不斷變化,顏色透明。進程運行時,連接對象數組的目標爲移動節點,運行完畢時目標改爲實際進程節點,以此達到連線的不斷移動。
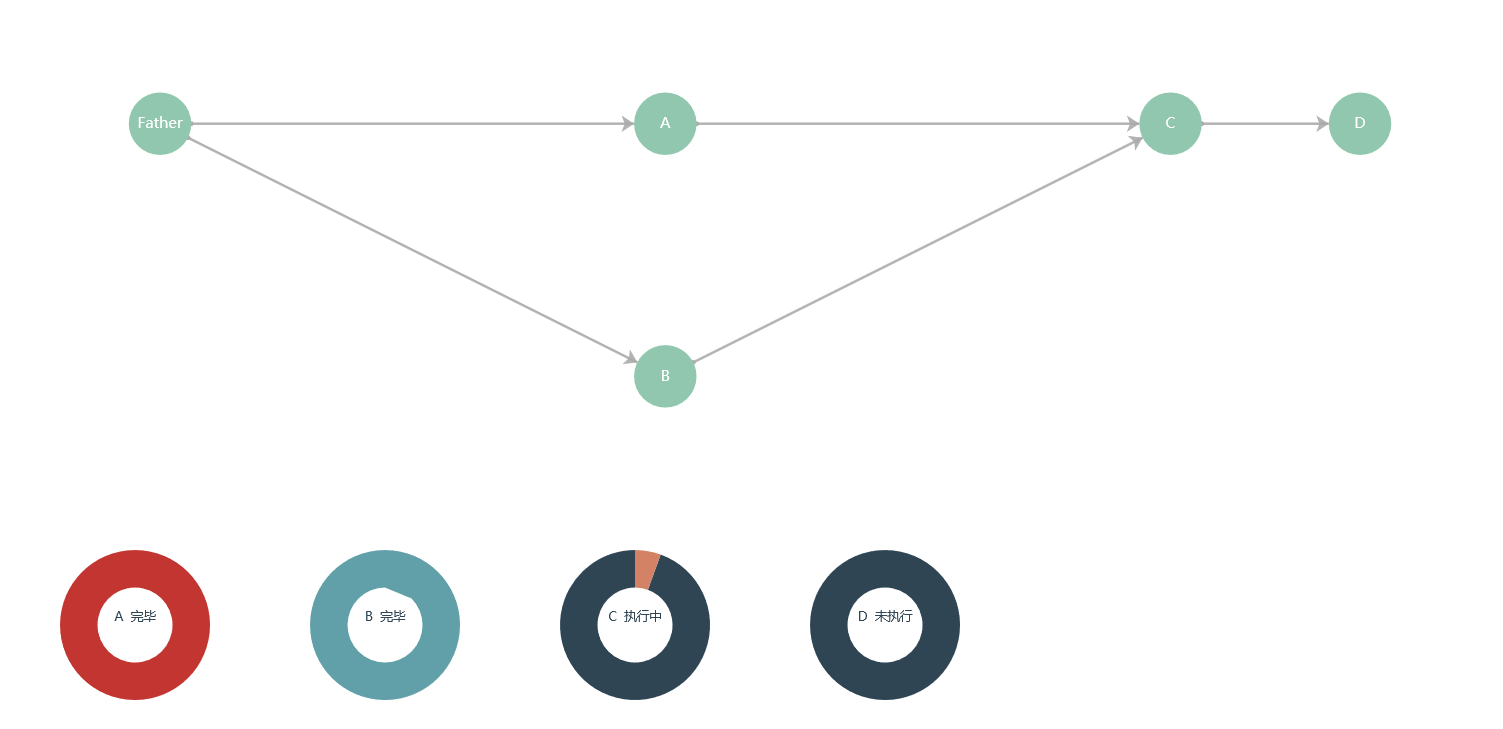
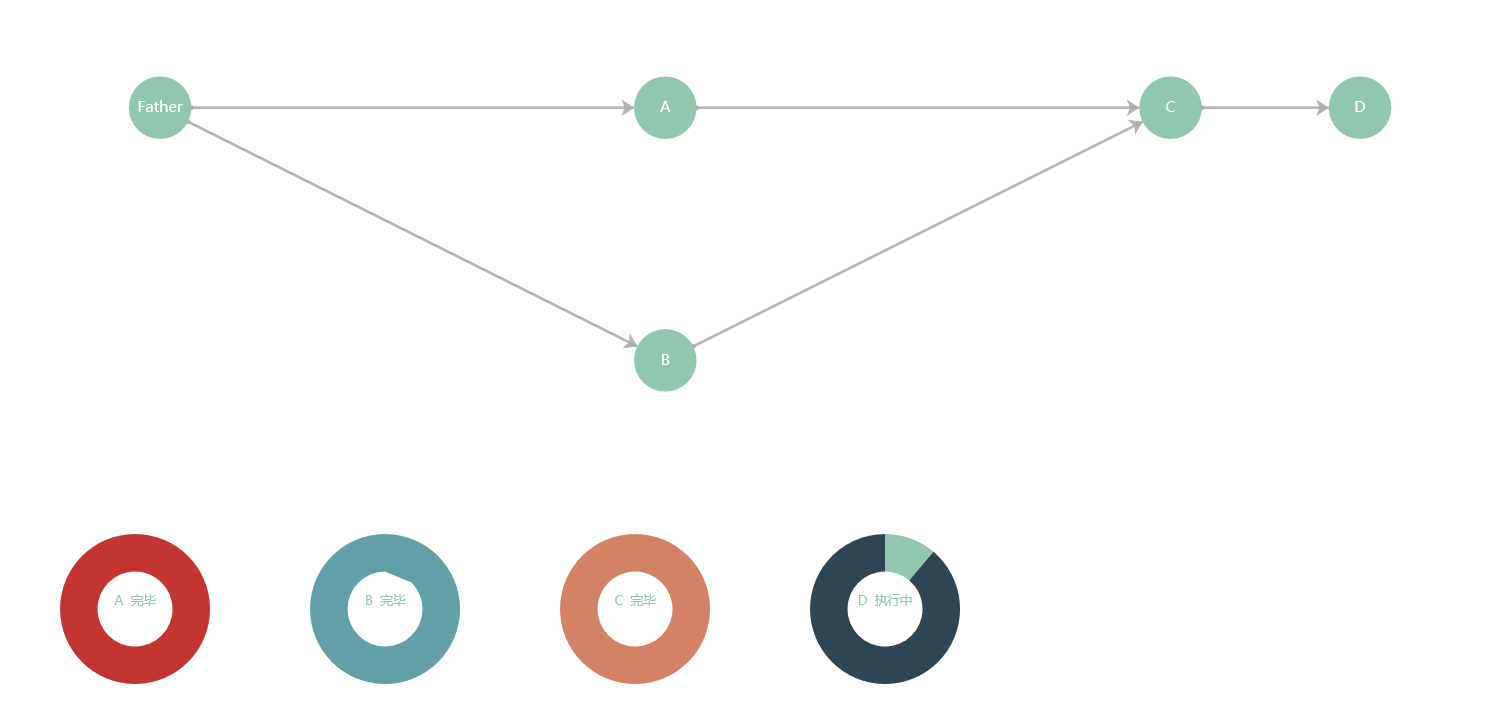
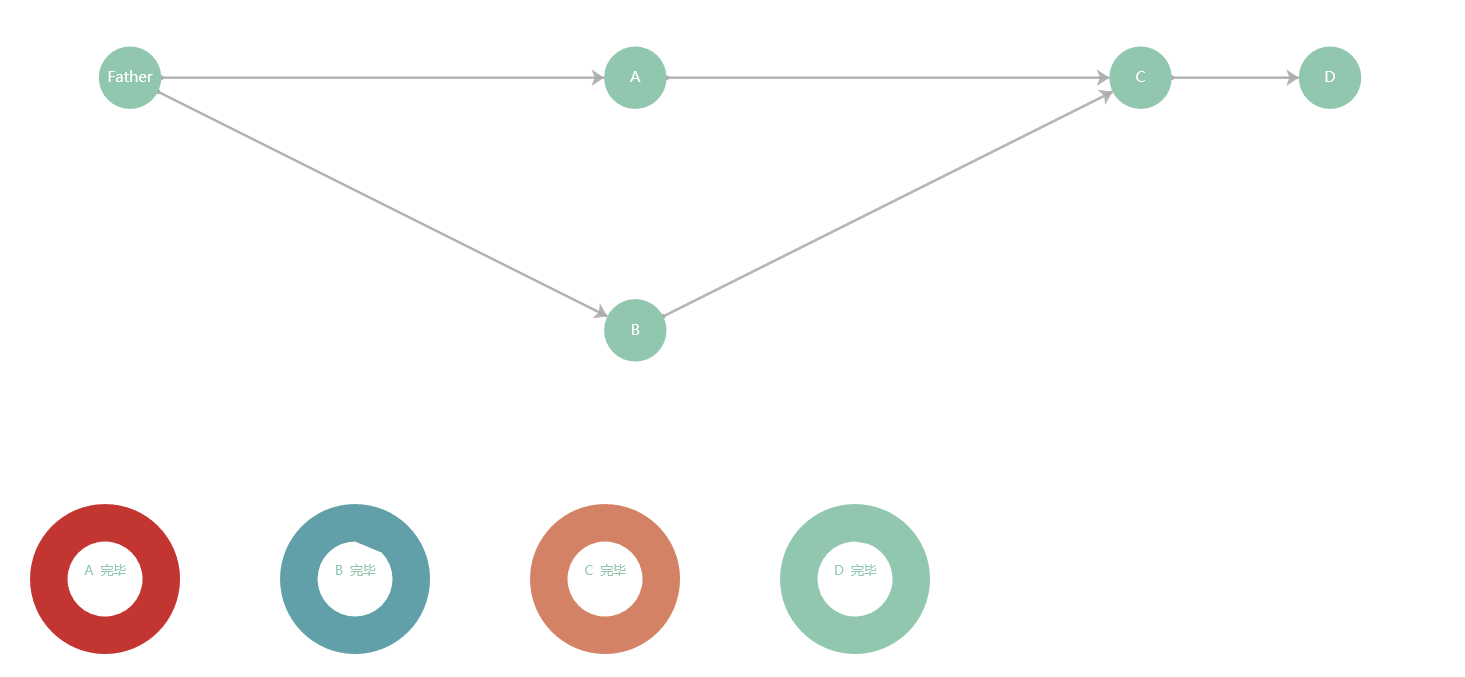
本次採用echarts內的pie圓環類型,動態改變數據來充當進度條
3.效果如下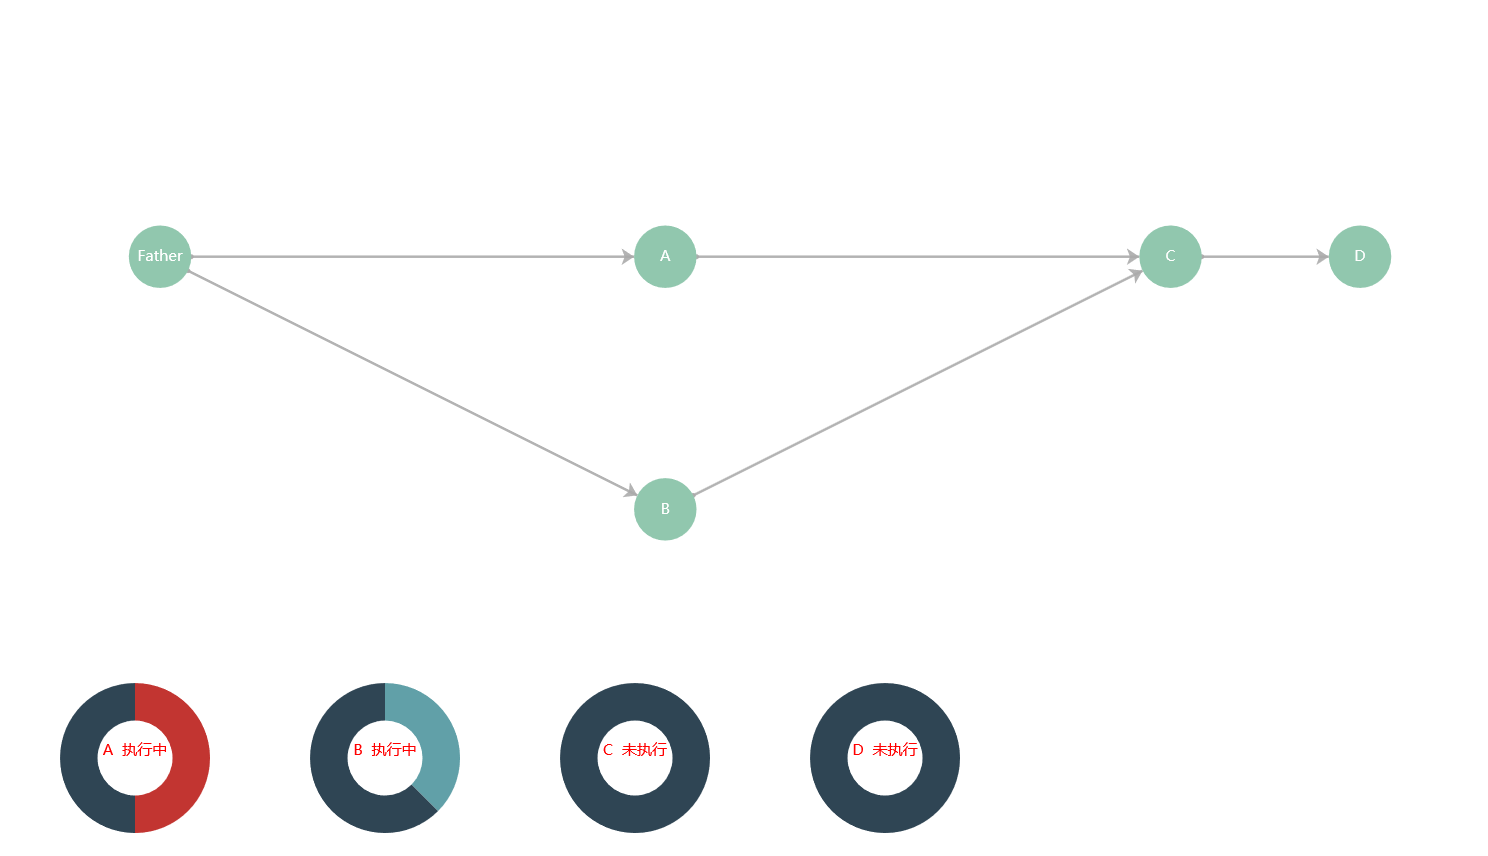
4.代碼如下
<html>
<head>
<meta charset="utf8"></meta>
<script src="echarts.js"></script>
<script type="text/javascript" src="loadxmldoc.js"></script>
<script src="http://lib.sinaapp.com/js/jquery/1.10.2/jquery-1.10.2.min.js"></script>
</head>
<body>
<div id="DrawBoard" style="width:1200px;height:1200px;"></div>
</body>
<script>
var myChart = echarts.init(document.getElementById("DrawBoard"));
xmlDoc=loadXMLDoc("custom.xml");
var process_num=xmlDoc.getElementsByTagName("processes")[0].childNodes;
var links = [];
var v=[];
var route=[];
var series=[];
var data2=[];
var data=new Array();
var process=new Array();
var move=new Array();
var r=100,t=900;
    for(var i=0;i<process_num.length;i++){
        var  name=xmlDoc.getElementsByTagName("name")[i].childNodes[0].nodeValue;
        process[name]=new Object();
        process[name].name=name;
        var strfrom=String(xmlDoc.getElementsByTagName("from")[i].childNodes[0].nodeValue);
        process[name].from=strfrom.split(" ");
        var strto=String(xmlDoc.getElementsByTagName("to")[i].childNodes[0].nodeValue);
        process[name].to=strto.split(" ");
        process[name].finish=String(xmlDoc.getElementsByTagName("isfinish")[i].childNodes[0].nodeValue);
        process[name].execT=String(xmlDoc.getElementsByTagName("execT")[i].childNodes[0].nodeValue);
        process[name].x=String(xmlDoc.getElementsByTagName("startx")[i].childNodes[0].nodeValue);
        process[name].y=String(xmlDoc.getElementsByTagName("starty")[i].childNodes[0].nodeValue);
        process[name].flag=String(xmlDoc.getElementsByTagName("flag")[i].childNodes[0].nodeValue);
        v[name]=new Object();
        v[name].x=process[name].x;
        v[name].y=process[name].y;
        v[name].name=name;
        v[name].flag=process[name].flag;
        data.push(v[name]);
        if(name=='Father'){continue;}
        var center=[];

        center.push(r);
        center.push(t);
        r+=200;

        data2[name]=[ {value:0, name:name+'  未執行'},{value:100, name:''}];
        series.push({
                name:name,
                type:'pie',
                radius: ['5%', '10%'],
                //zlevel: 999,
                avoidLabelOverlap: true,
                hoverAnimation:false,
                center:center,
                size: '15',
                label: {
                    normal: {
                        show: true,
                        color:'red',
                        size:'20',
                        position: 'center'
                    },

                },

                labelLine: {
                    normal: {
                        show: true
                    }
                },
                data:data2[name]
            });

    }
     series.push( {
        type: 'graph',
        layout: 'none',
        symbolSize: 50,
        roam: true,
        label: {
            normal: {
                show: true
            }
        },
        edgeSymbol: ['circle', 'arrow'],
        edgeSymbolSize: [4, 10],
        edgeLabel: {
            normal: {
                textStyle: {
                    fontSize: 20
                }
            }
        },
        data:data,
        links:links,
        lineStyle: {
            normal: {
                opacity: 0.9,
                width: 2,
                curveness: 0
            }
        }
    });
    option = {
        title: {
                text: '進程可視化'
            },
         tooltip: {},
             animationDurationUpdate: 0,
             animationEasingUpdate: 'quinticInOut',
         series :series
    }
for(i in process){
for(j in process[i].to){
if(process[i].name==process[i].to[j]){
break;
}
move[process[i].name+","+process[i].to[j]]={'flag':process[process[i].to[j]].flag,'startx':process[i].x,'symbolSize': 50,'name':process[i].name+","+process[i].to[j],'x':0,'y':0,'label':{show:false},'total':parseFloat(process[process[i].to[j]].x-process[i].x),'speedx':parseFloat(process[process[i].to[j]].x-process[i].x)/process[process[i].to[j]].execT,'speedy':parseFloat(process[process[i].to[j]].y-process[i].y)/process[process[i].to[j]].execT,'itemStyle': {opacity: 0.0}};
route[process[i].name+","+process[i].to[j]]={'source':process[i].name ,'target':process[i].to[j]};
links.push(route[process[i].name+","+process[i].to[j]]);
}
}
setInterval(function(){
for(i in move){
var temp=move[i].name.split(",");
var ff=1;
for(j in move){
var temp2=move[j].name.split(",");
if(temp[1]==temp2[1]&&process[temp2[0]].finish!=1&&process[temp2[0]].flag!=1){
ff=0;
break;
}
}
if(ff==1&&process[temp[1]].finish!=1){
//alert(temp[1]+" "+move[i].speedx+" "+move[i].x);
move[i].x=parseFloat(move[i].x)+parseFloat(move[i].speedx);
//move[i].y=parseFloat(move[i].y)+parseFloat(move[i].speedy);
data2[temp[1]][0].value=move[i].x;
data2[temp[1]][0].name=temp[1]+' 執行中';
data2[temp[1]][1].value=move[i].total-move[i].x;
}
if(move[i].x>move[i].total){
//route[i].target=process[temp[1]].name;
data2[temp[1]][0].name=temp[1]+' 完畢';
process[temp[1]].finish=1;
}
}
myChart.setOption(option);
},1000);
</script>
</html>