


一、安裝
1.1、配置influxdb yum源
[root@node ~]# cat /etc/yum.repos.d/influxdb.repo
[influxdb]
name = InfluxDB Repository - RHEL \$releasever
baseurl = https://repos.influxdata.com/rhel/\$releasever/\$basearch/stable
enabled = 1
gpgcheck = 1
gpgkey = https://repos.influxdata.com/influxdb.key
1.2、安裝Grafana+influxdb+telegraf
安裝influxdb
yum install influxdb
安裝telegraf
yum install telegraf
安裝grafana
wget https://dl.grafana.com/oss/release/grafana-6.1.3-1.x86_64.rpm
yum localinstall grafana-6.1.3-1.x86_64.rpm
1.3、軟件版本
InfluxDB version: 1.7.4
Telegraf version: 1.10.2
Grafana version: 6.1.3
1.4、啓動服務,添加開機啓動
systemctl start influxdb.service
systemctl start telegraf.service
systemctl start grafana-server.service

systemctl enable influxdb.service
systemctl enable telegraf.service
systemctl enable grafana-server.service
1.5、查看grafana界面
grafana默認監聽在3000端口,默認用戶名admin,密碼admin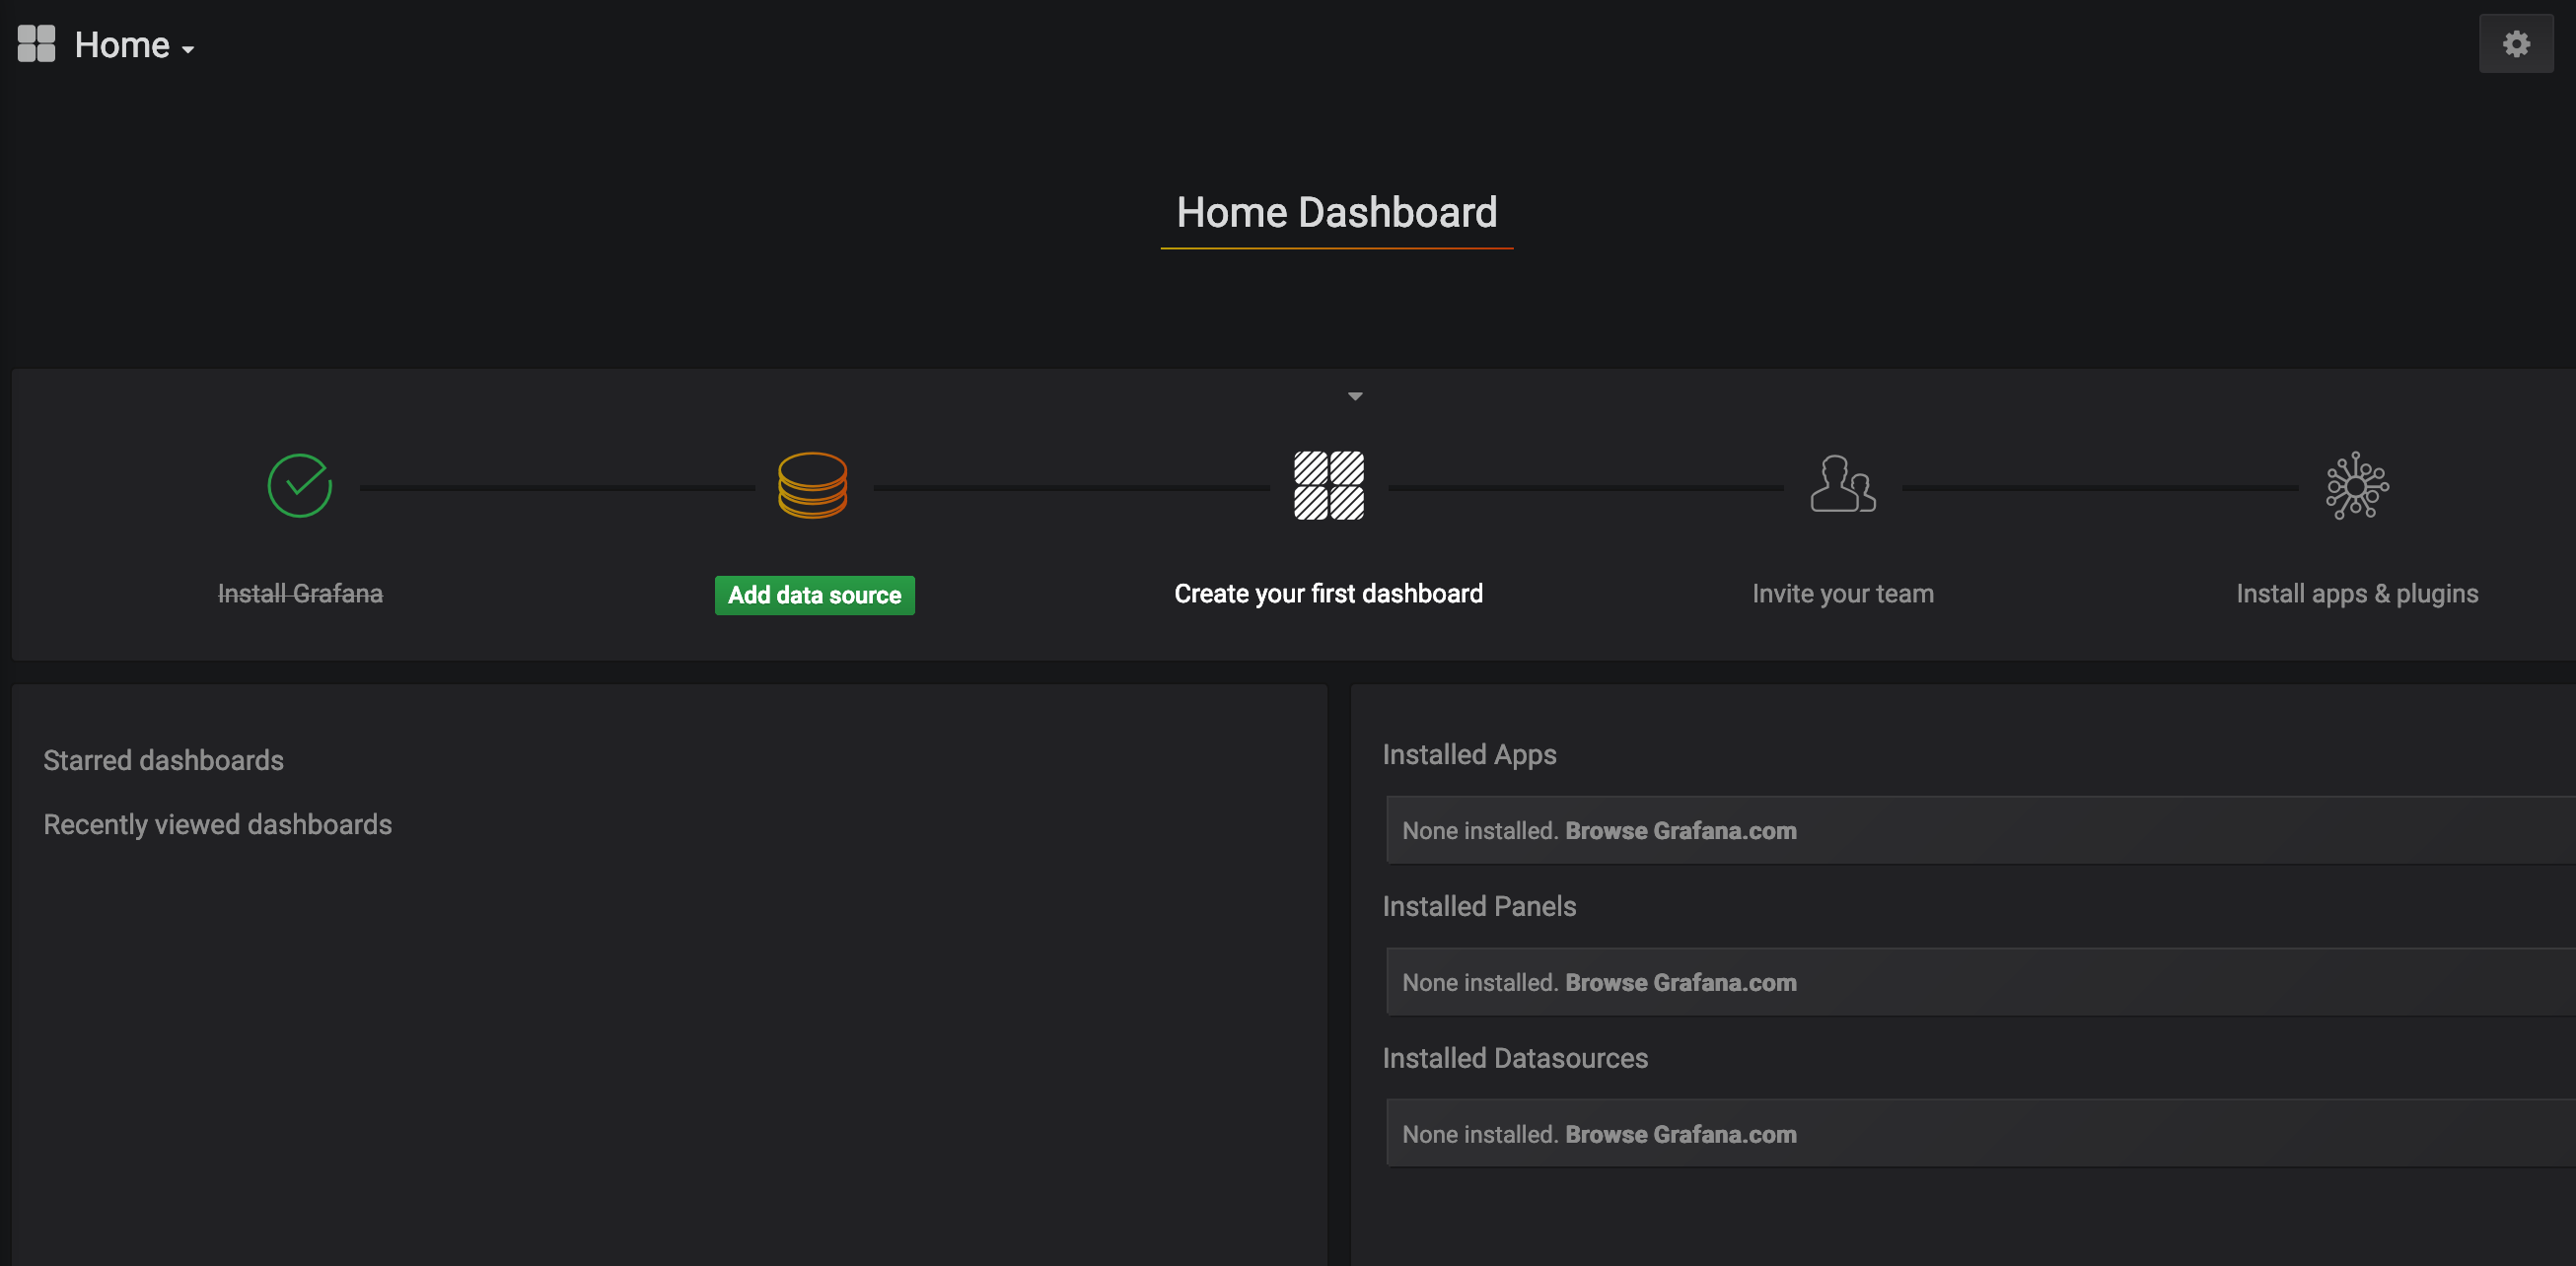
二、數據採集之telegraf
Telegraf是用Go寫的代理程序,可以用於收集系統和服務的統計數據,是TICK技術棧的一部分。它具備輸入插件,可以直接從系統獲取指標數據,從第三方API獲取指標數據,甚至可以通過statsd和Kafka獲取指標數據。它還具備輸出插件,可以將採集的指標發送到各種數據存儲,服務和消息隊列。比如InfluxDB,Graphite,OpenTSDB,Datadog,Librato,Kafka,MQTT,NSQ等等,目前Telegraf尚不支持Oracle數據庫統計數據的實時監控。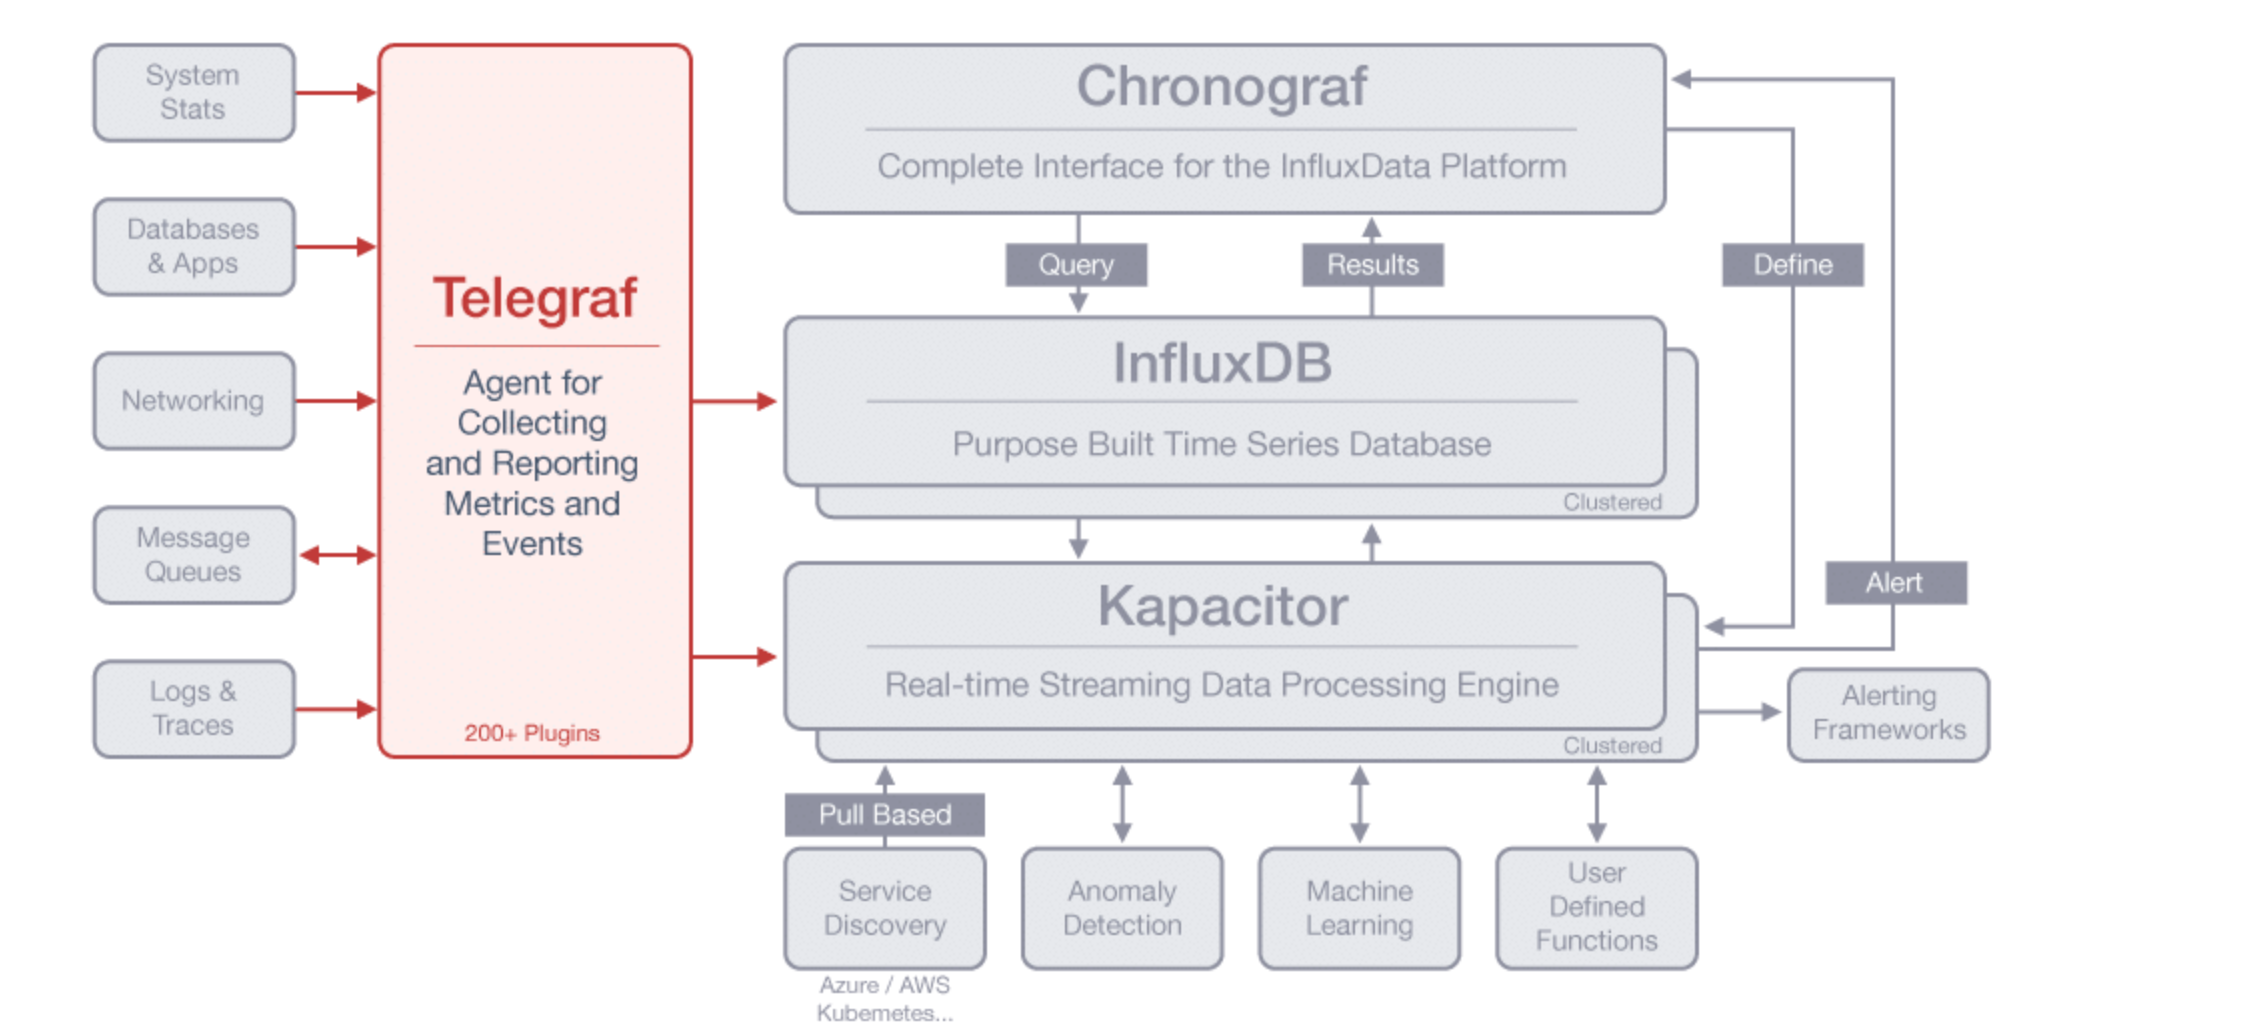
來自於官網:https://www.influxdata.com/time-series-platform/telegraf/
三、數據存儲之InfluxDB
InfluxDB是一個時間序列數據庫,旨在處理高寫入和查詢負載,主要用於存儲系統的監控數據
InfluxDB有三大特性:
• Time Series (時間序列):可以使用與時間有關的相關函數(如最大,最小,求和等)
• Metrics(度量):你可以實時對大量數據進行計算
• Eevents(事件):它支持任意的事件數據
特點
• Schemaless(無結構),可以是任意數量的列
• Scalable(可擴展):min, max, sum, count, mean, median 一系列函數,方便統計
• Native HTTP API, 內置http支持,使用http讀寫
• Powerful Query Language 類似sql
• 自帶壓力測試工具等,功能強大
四、數據展示之Grafana
Grafana是一個開源指標分析和可視化套件,常用於可視化基礎設施的性能數據和應用程序分析的時間序列數據。也可以應用於其他領域,包括工業傳感器,家庭自動化,天氣和過程控制。但請注意,我們使用Grafana最關心的是如何把數據進行聚合後進行展示。
Grafana支持多種不同的時序數據庫數據源,Grafana對每種數據源提供不同的查詢方法,而且能很好的支持每種數據源的特性。它支持下面幾種數據源:Graphite、Elasticsearch、CloudWatch、InfluxDB、OpenTSDB、Prometheus、MySQL、Postgres、Microsoft SQL Server (MSSQL)。每種數據源都有相應的文檔,可以將多個數據源的數據合併到一個單獨的儀表板上。
五、配置監控主機狀態及mysql運行狀態
5.1、創建數據庫
[root@node ~]# influx
> create user "mysql-server"with password '123456'
> create database myserverDB
5.2、配置本機的influxdb數據庫爲期望的輸出源-output
[root@node ~]# vim /etc/telegraf/telegraf.conf
[[outputs.influxdb]]
  urls = ["http://127.0.0.1:8086"]
  database = "myserverDB"
5.3、配置監控項-input
配置基本監控項
[root@node ~]# cat /etc/telegraf/telegraf.d/telegraf.conf
[[inputs.net]]
interfaces = ["eth0,eth1,lo"]
[[inputs.cpu]]
  ##Whether to report per-cpu stats or not
 percpu = true
  ##Whether to report total system cpu stats or not
 totalcpu = true
  ## Iftrue, collect raw CPU time metrics.
 collect_cpu_time = false
# Read metrics about disk usage by mountpoint
[[inputs.disk]]
  ## Bydefault, telegraf gather stats for all mountpoints.
  ##Setting mountpoints will restrict the stats to the specified mountpoints.
  #mount_points = ["/"]
  ##Ignore some mountpoints by filesystem type. For example (dev)tmpfs (usually
  ##present on /run, /var/run, /dev/shm or /dev).
 ignore_fs = ["tmpfs", "devtmpfs"]
# Read metrics about disk IO by device
[[inputs.diskio]]
[[inputs.kernel]]
[[inputs.mem]]
[[inputs.processes]]
[[inputs.swap]]
[[inputs.system]]
[[inputs.netstat]]
配置mysql監控項
[root@node ~]# cat /etc/telegraf/telegraf.d/telegraf_mysql.conf
[[inputs.mysql]]
  interval = "5m"
  servers = ["tcp(127.0.0.1:3306)/"]
  perf_events_statements_digest_text_limit  = 120
  perf_events_statements_limit              = 250
  perf_events_statements_time_limit         = 86400
  table_schema_databases                    = [""]
  gather_table_schema                       = false

  gather_process_list                       = true

  gather_info_schema_auto_inc               = true

  gather_slave_status                       = true
  gather_binary_logs                        = false
  gather_table_io_waits                     = false
  gather_table_lock_waits                   = false
  gather_index_io_waits                     = false
  gather_event_waits                        = false
  gather_file_events_stats                  = false
  interval_slow                             = "30m"
5.4、配置grafana界面
選擇Data Sources,添加需要的數據源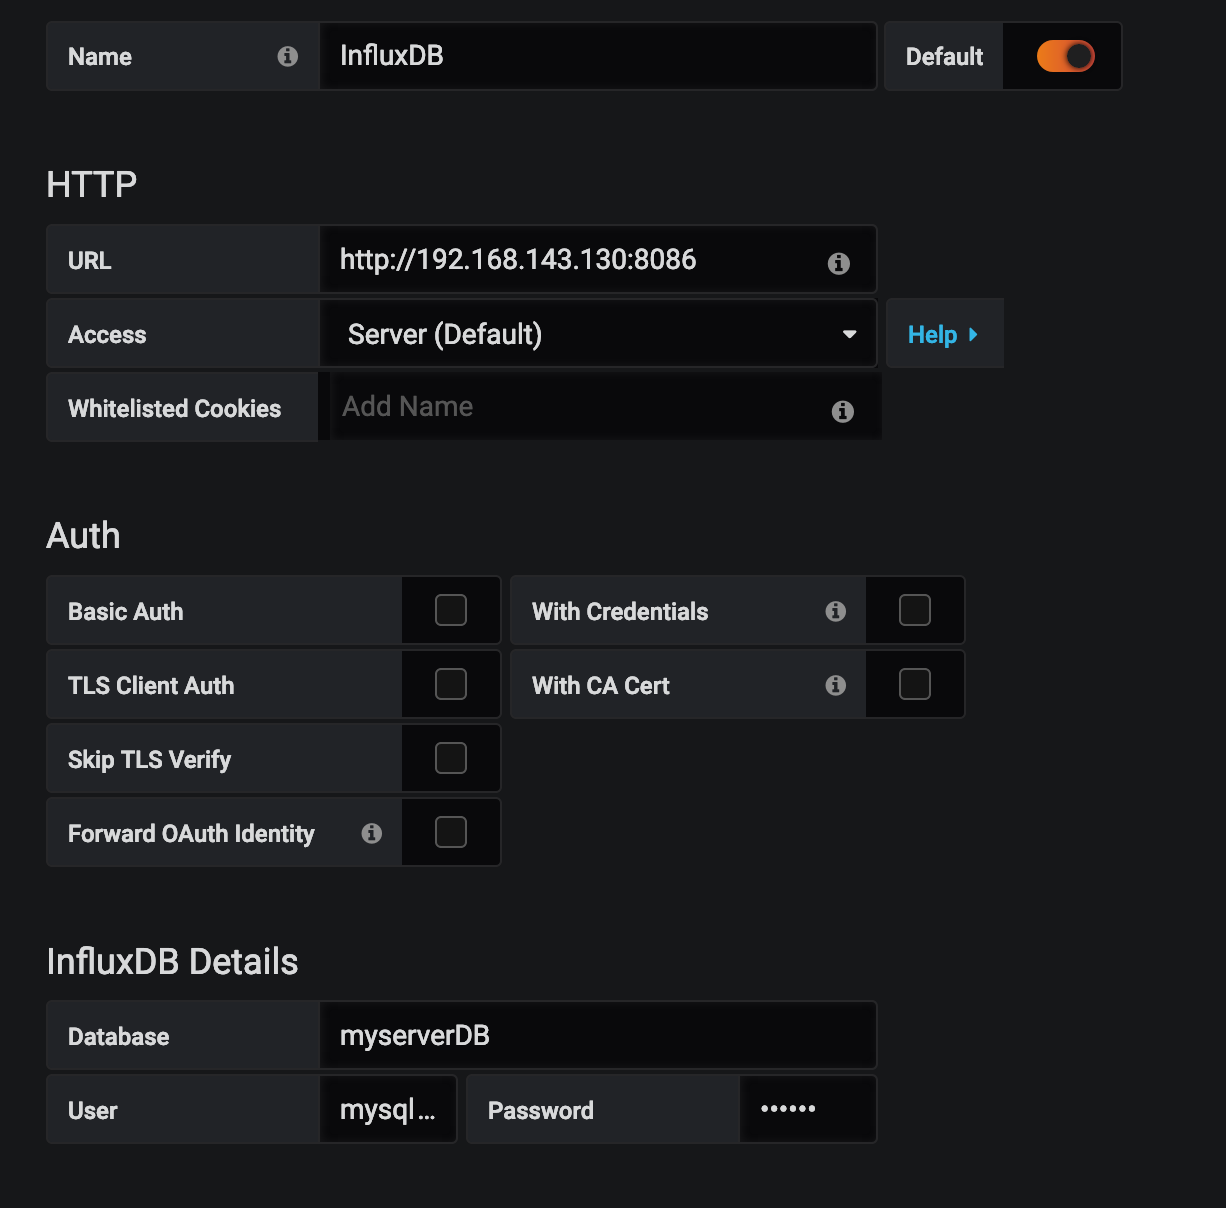
創建主機儀表盤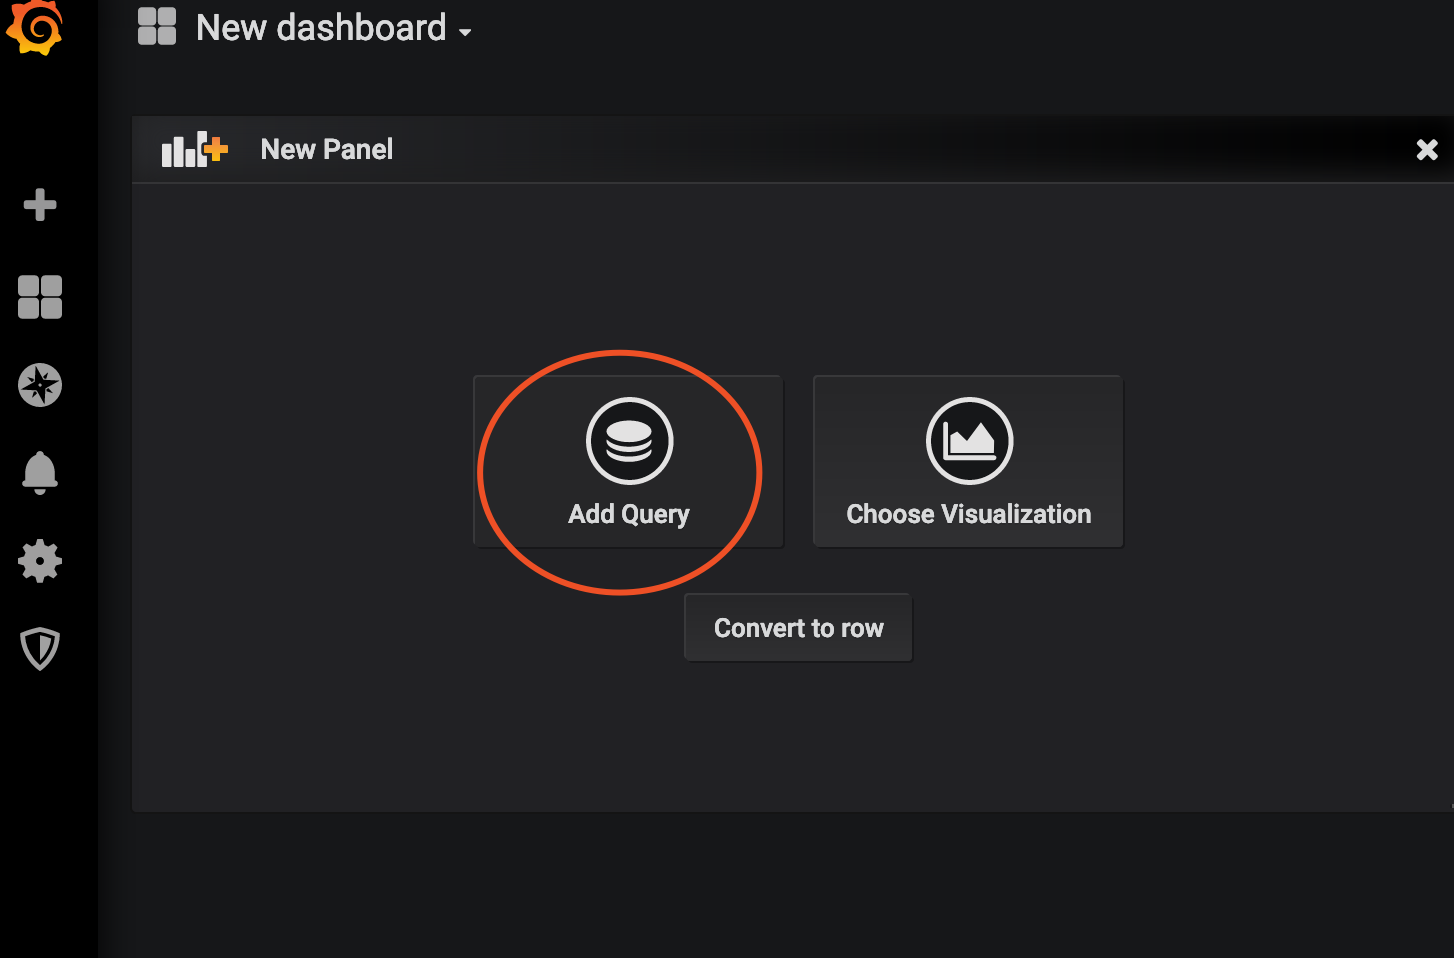
可以通過訪問https://grafana.com/dashboards 來查看已經由其他用戶共享的儀表盤,選取合適的使用,縮短上手時間
將合適的模版import導入,我這裏用的是https://grafana.com/dashboards/1443, 注意模版與telegraf input配置一致。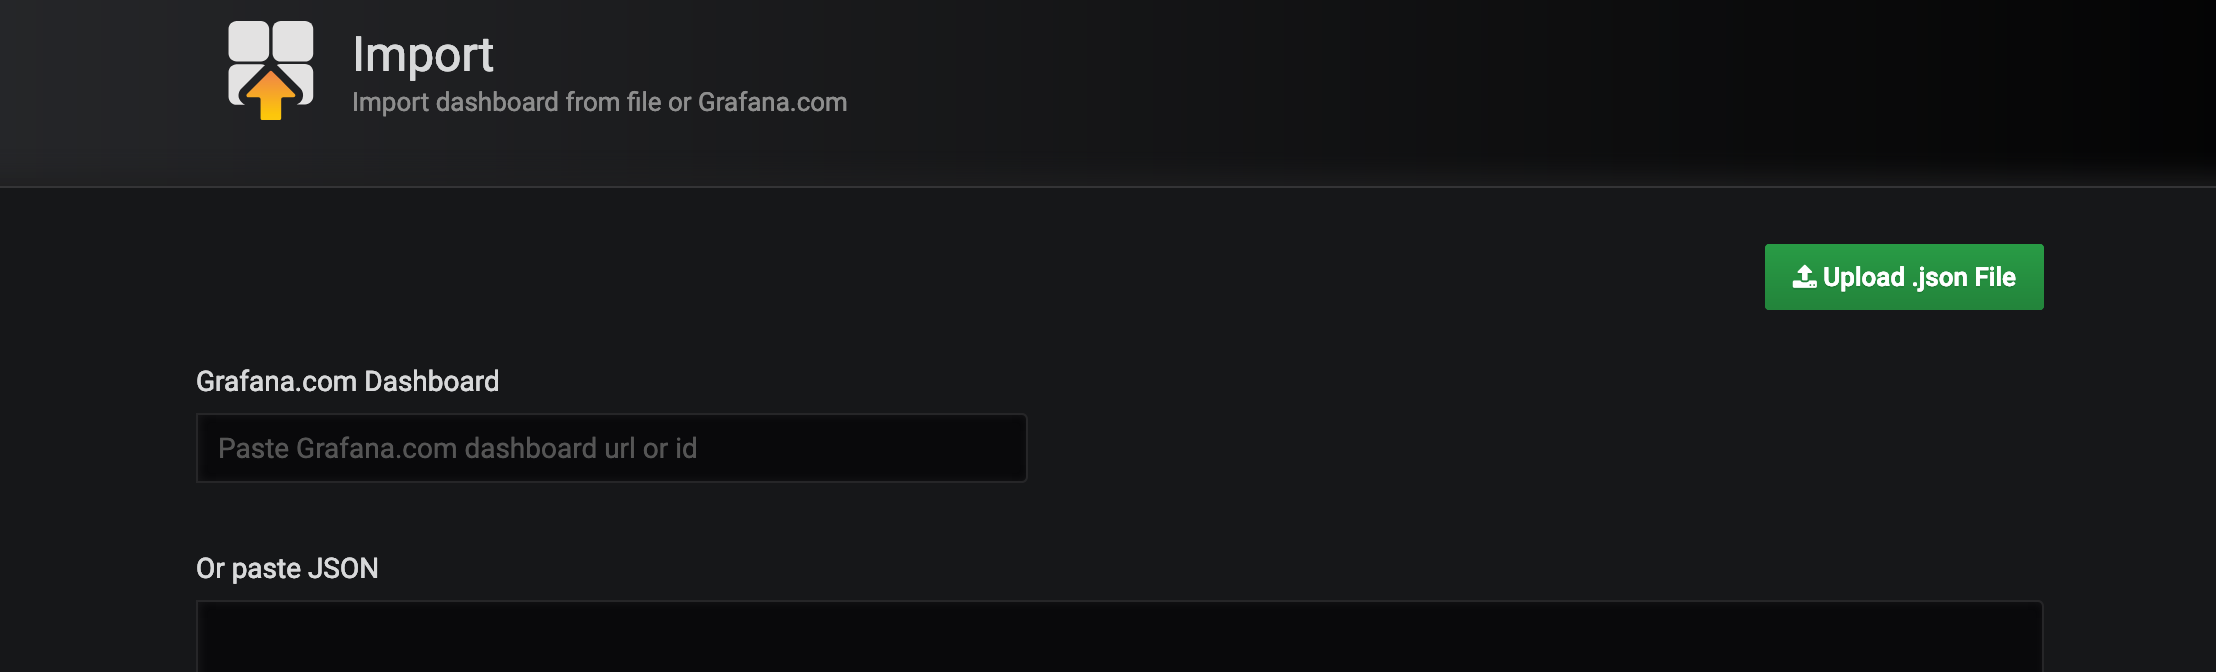
可以看到如下界面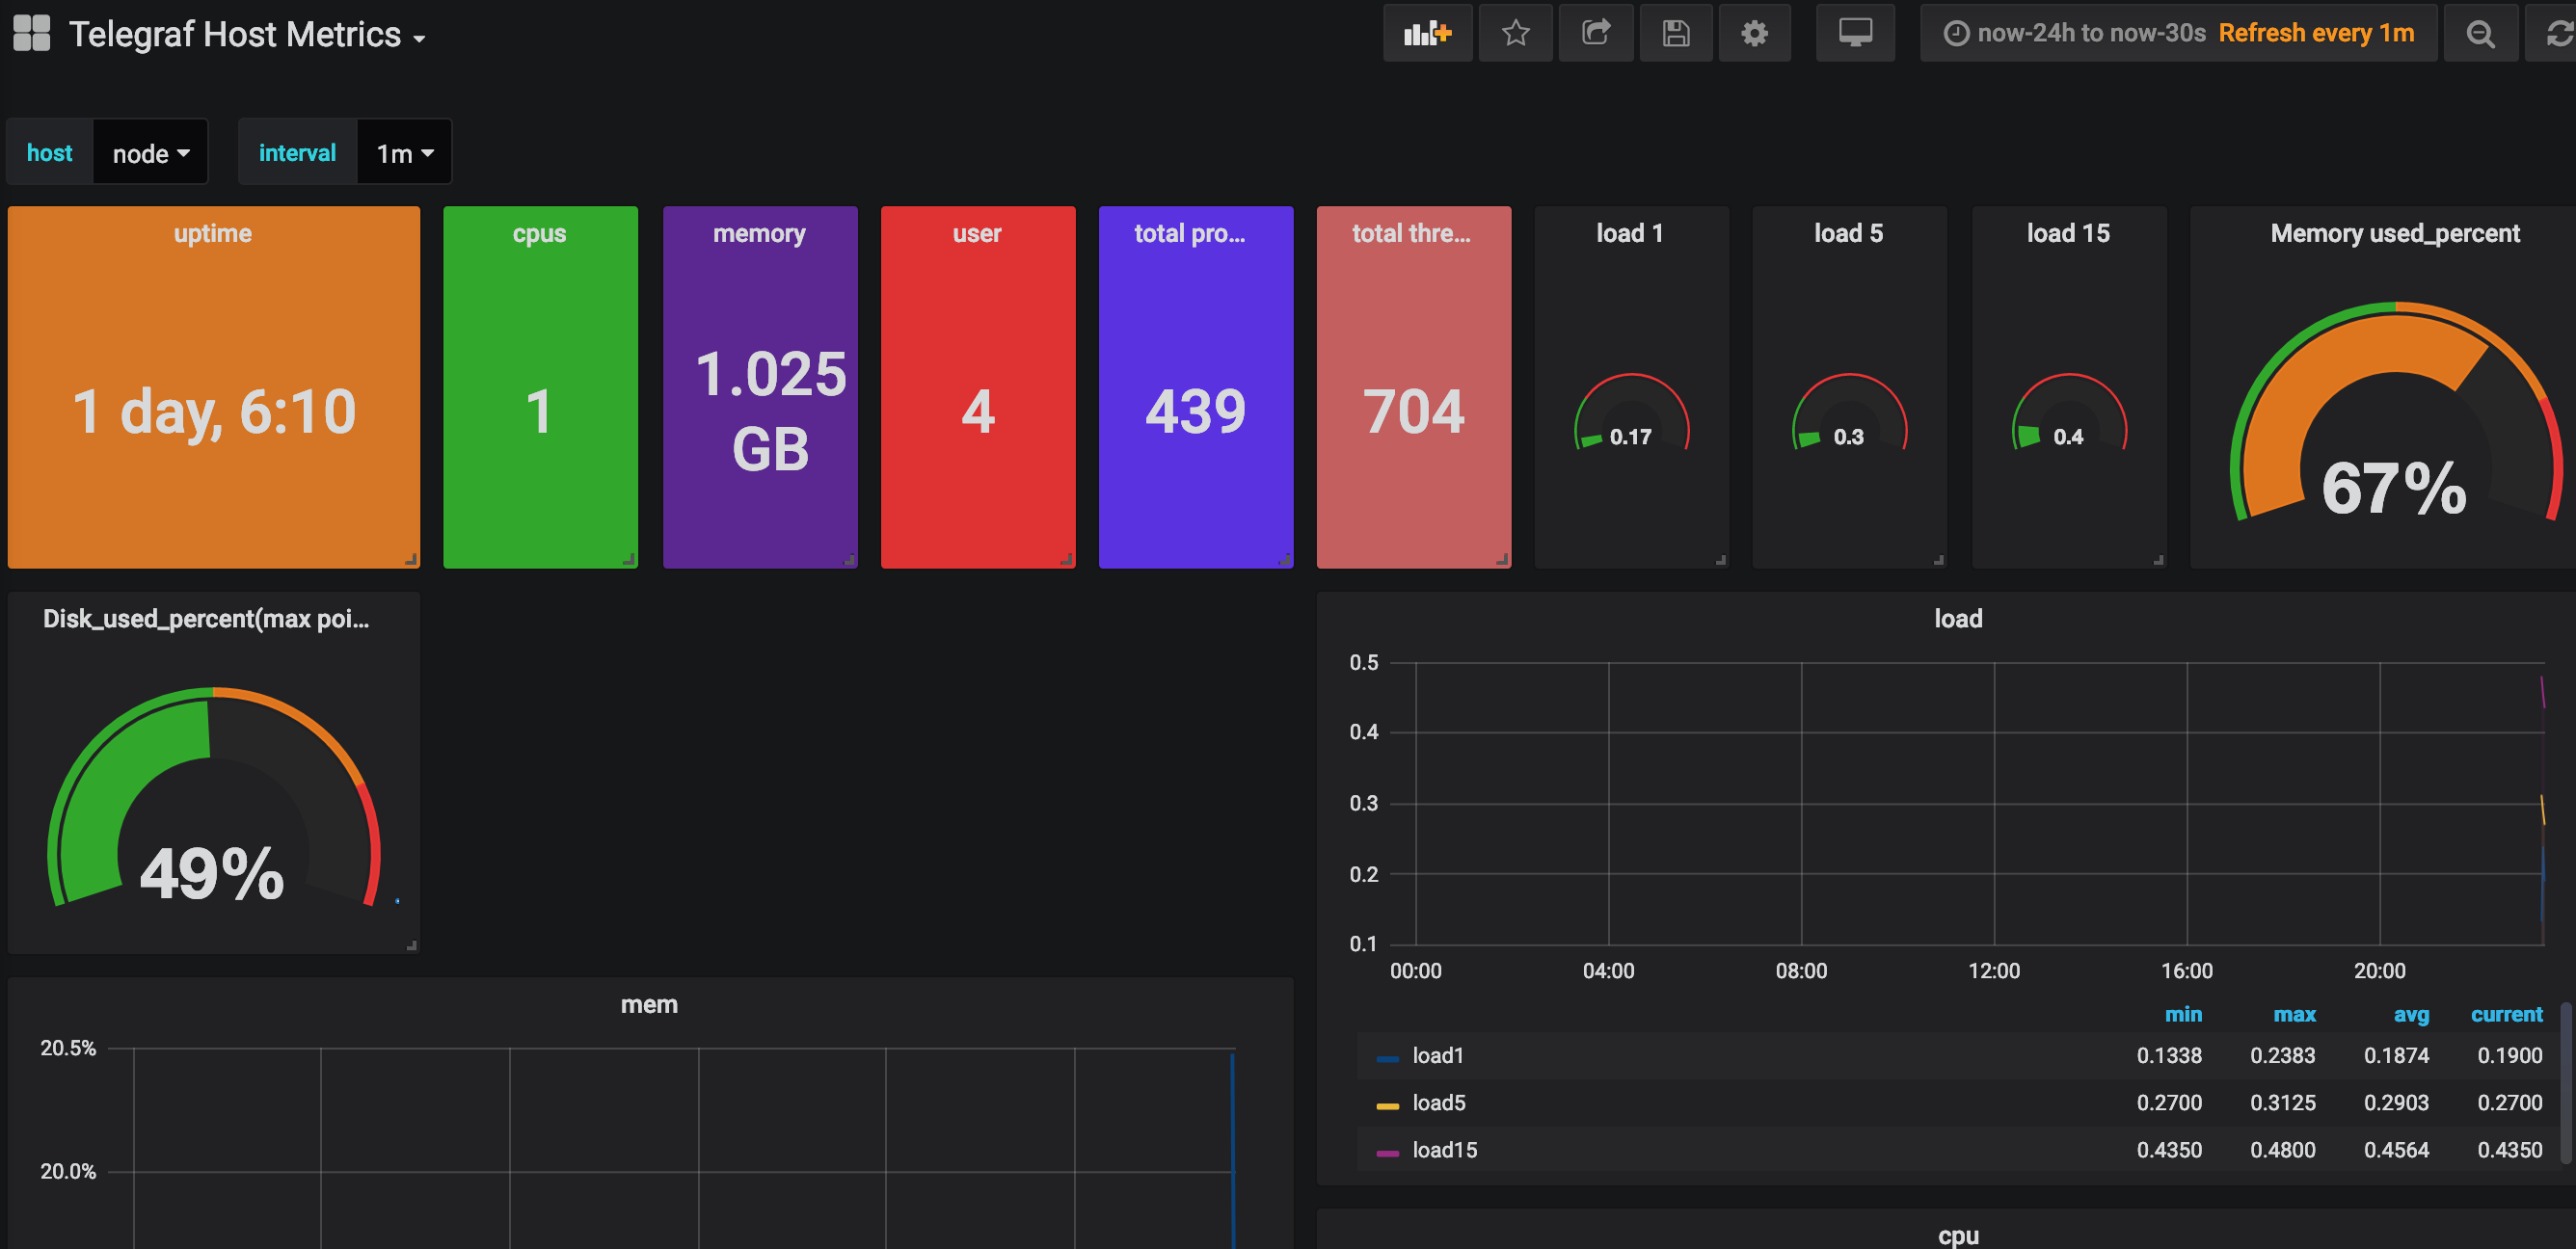
創建mysql儀表盤
import https://grafana.com/dashboards/1177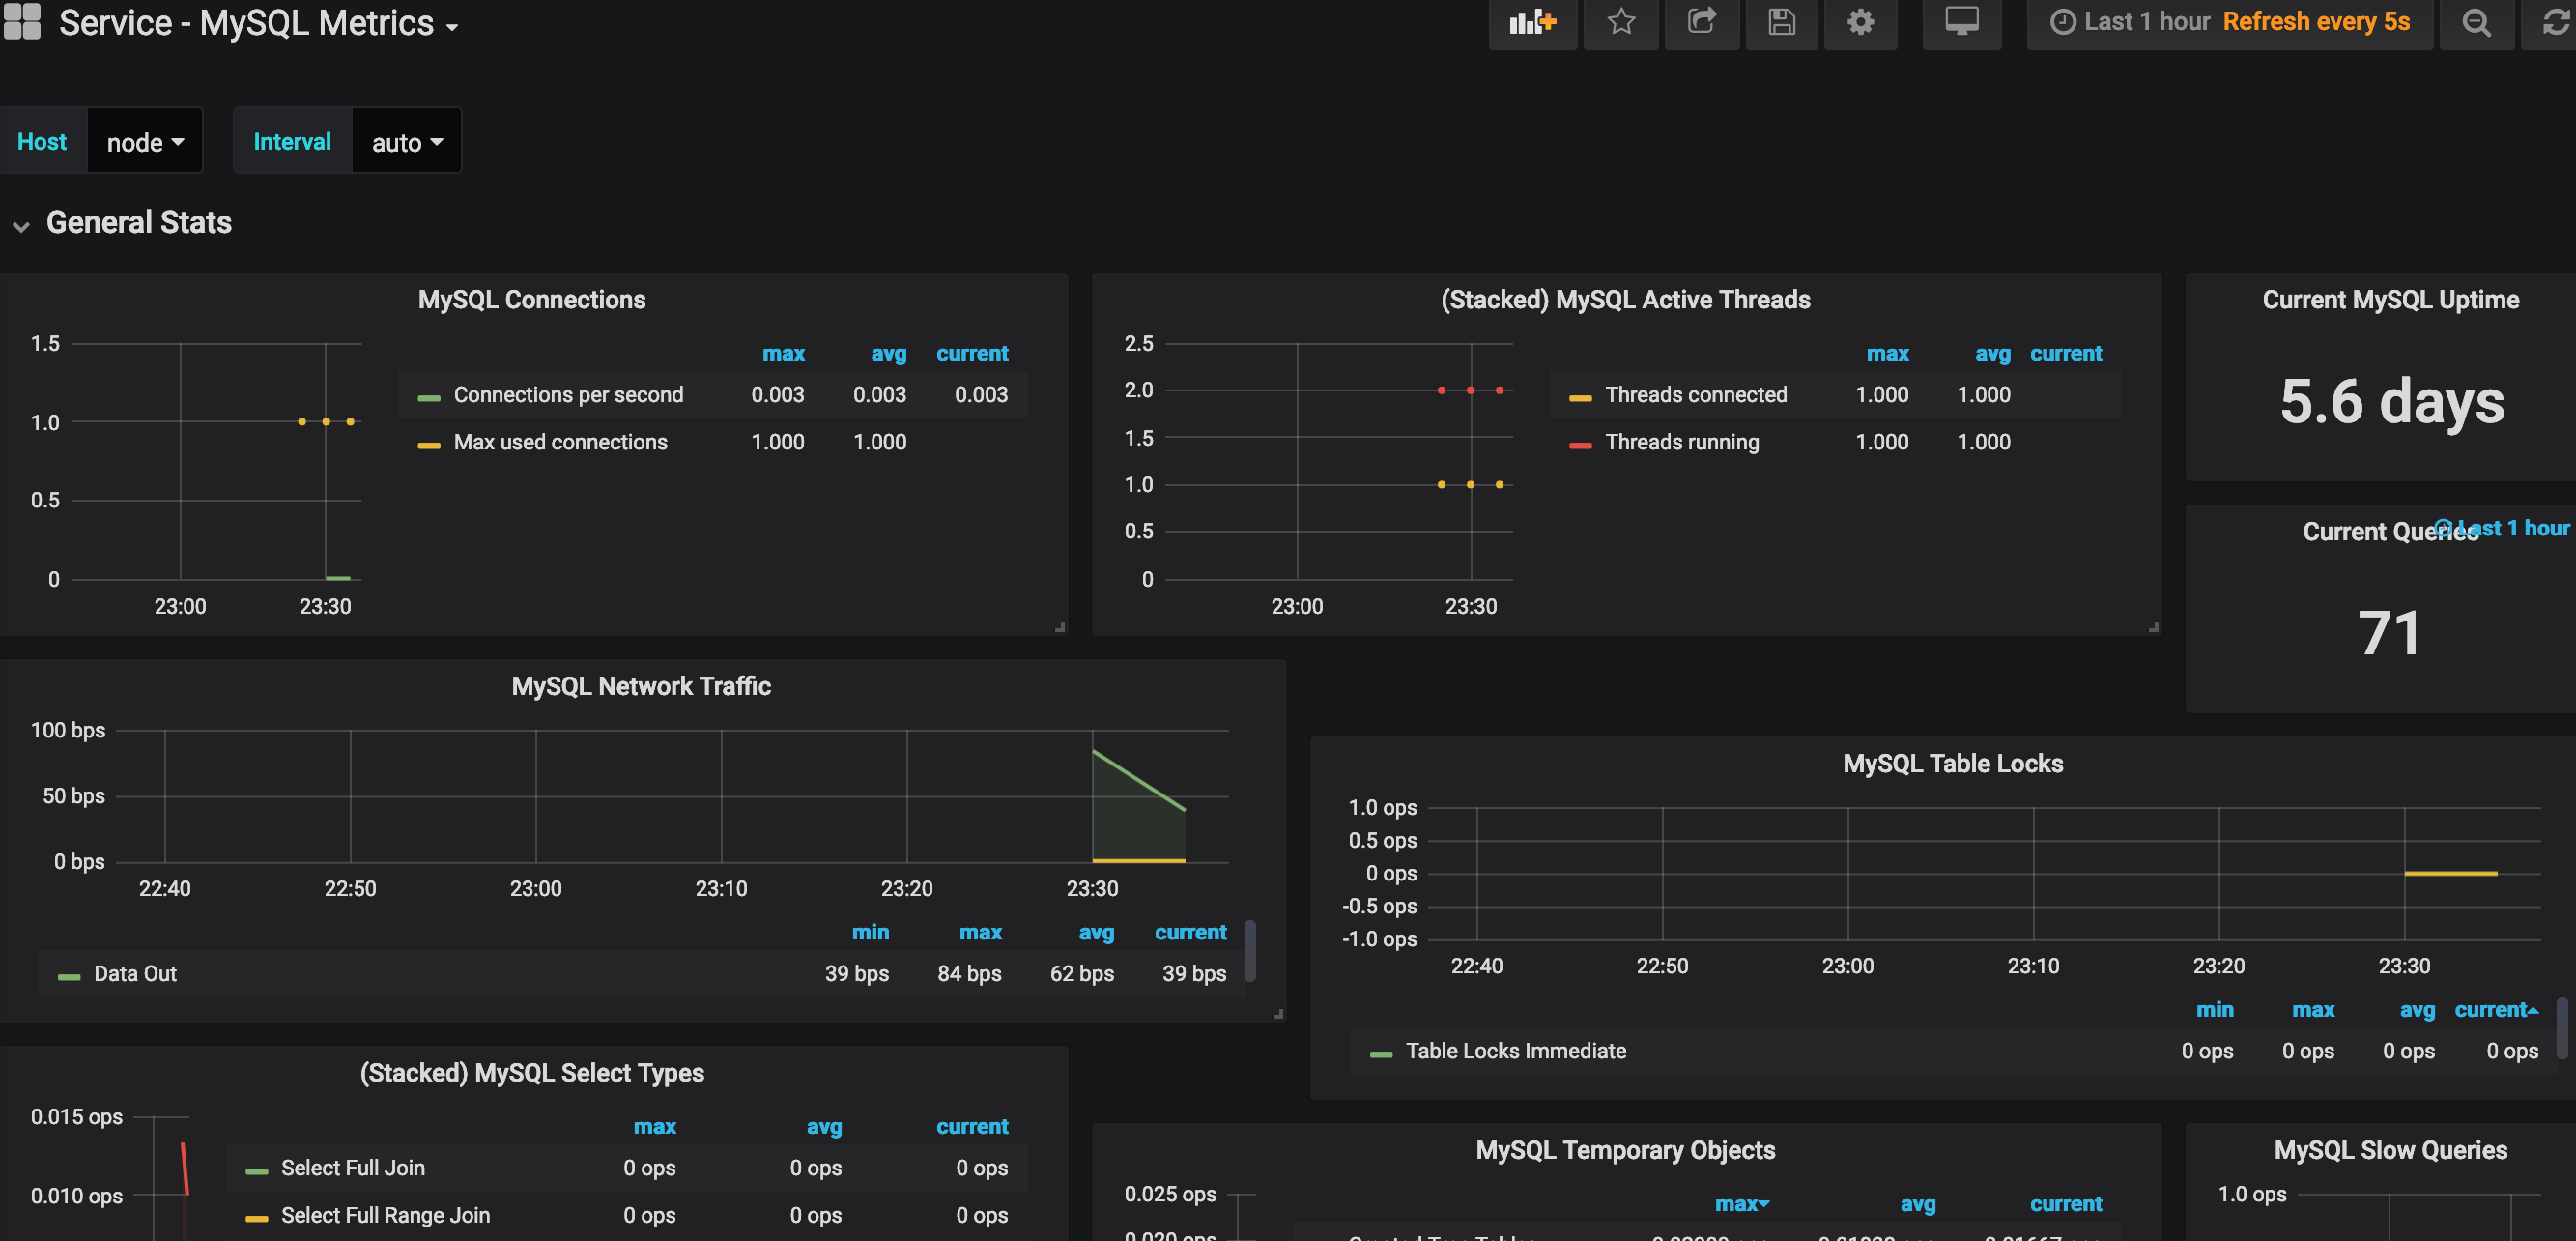
參考文章
https://www.influxdata.com/time-series-platform/telegraf/
https://docs.influxdata.com/telegraf/v1.10/
https://docs.influxdata.com/influxdb/v1.7/
https://grafana.com/grafana
https://juejin.im/post/5b4568c851882519790c72f3