


環境說明:
| 主機名 | Docker版本 | Prometheus版本 | Node exporter版本 | cAdvisor版本 | Grafana版本 | ip地址 |
|---|---|---|---|---|---|---|
| docker01 | 18.09.2 | 2.9.2 | 0.18.0 | v0.32.0 | v6.1.6 | 172.27.9.71 |
| docker02 | 18.09.2 | / | 0.18.0 | v0.32.0 | / | 172.27.9.75 |
ubuntu安裝詳見:Ubuntu16.04.5以lvm方式安裝全記錄
docker安裝詳見:Ubuntu16.04安裝Docker
docker-compose安裝詳見:Docker Compose實踐
一、Prometheus簡介
Prometheus是一套開源的系統監控報警框架,提供了監控數據蒐集、存儲、處理、可視化和告警一套完整的解決方案,該項目於2012年在SoundCloud上創建,擁有非常活躍的開發人員和用戶社區,許多公司和組織都採用了Prometheus。作爲一個獨立的開源項目,Prometheus於2016年正式加入Cloud Native Computing Foundation,成爲受歡迎度僅次於Kubernetes的項目。
Prometheus特點:
- 多維數據模型,其中時間序列數據通過metric名和鍵值對來區分。
- 靈活而強大的查詢語句(PromQL)
- 不依賴分佈式存儲,可直接在本地工作
- 通過HTTP使用pull模式採集時間序列數據
- 可以採用push gateway的方式把時間序列數據推送至 Prometheus server 端
- 可以通過服務發現或者靜態配置去獲取監控的 targets
- 支持多種圖形和儀表盤模式
二、Prometheus架構
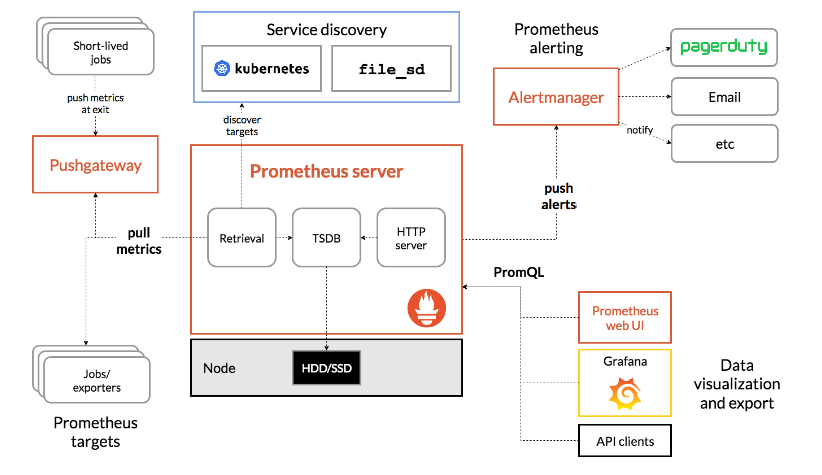
組件:
Prometheus生態圈由多個組件組成,其中許多是可選的:
- Prometheus Server: 用於抓取和存儲時間序列數據。
- Client Library:爲需要監控的服務生成相應的 metrics 並暴露給 Prometheus server。
- Push Gateway:主要用於短期的jobs。
- Exporters: 用於暴露已有的第三方服務的metrics給Prometheus。
- Alertmanager: 用於處理告警。
- 其他的支持工具。
大多數普羅米修斯組件都是用go編寫的,這使得它們很容易作爲靜態二進制文件進行構建和部署。
工作流程:
1. Prometheus server 定期從配置好的 jobs 或者 exporters 中拉 metrics,或者接收來自 Pushgateway 發過來的 metrics,或者從其他的 Prometheus server 中拉 metrics。
2. Prometheus server 在本地存儲收集到的 metrics,並運行已定義好的 alert.rules,記錄新的時間序列或者向 Alertmanager 推送警報。
3. Alertmanager 根據配置文件,對接收到的警報進行處理,發出告警。
4. 在圖形界面中,可視化採集數據。
三、Prometheus搭建
1. 環境說明
| 主機名 | Prometheus Server | Node Exporter | cAdvisor | Grafana |
|---|---|---|---|---|
| docker01 | √ | √ | √ | √ |
| docker02 | × | √ | √ | × |
通過Prometheus監控docker01和docker02,其中Node Exporter用於監控host,cAdvisor用於監控容器,這兩個監控軟件兩個節點都部署。Prometheus Server和Grafana只在docker01上部署,充當監控監控服務器。
2. 監控主機部署
2.1 docker-compose.yml配置
root@docker02:~# more docker-compose.yml
version: '3.7'

services:
  node-exporter:
    image: prom/node-exporter:latest
    network_mode: 'host'
    container_name: node-exporter
    restart: unless-stopped
    ports:
      - '9100:9100'
    command:
      - '--path.procfs=/host/proc'
      - '--path.sysfs=/host/sys'
      - '--collector.filesystem.ignored-mount-points=^/(sys|proc|dev|host|etc)($$|/)'
    volumes:
      - /proc:/host/proc
      - /sys:/host/sys
      - /:/rootfs

  cadvisor:
    image: google/cadvisor:latest
    network_mode: 'host'
    container_name: cadvisor
    restart: unless-stopped
    ports:
      - '8080:8080'
    volumes:
      - /:/rootfs:ro
      - /var/run:/var/run:rw
      - /sys:/sys:ro
      - /var/lib/docker/:/var/lib/docker:ro
2.2 運行docker-compose
root@docker02:~# docker-compose up -d 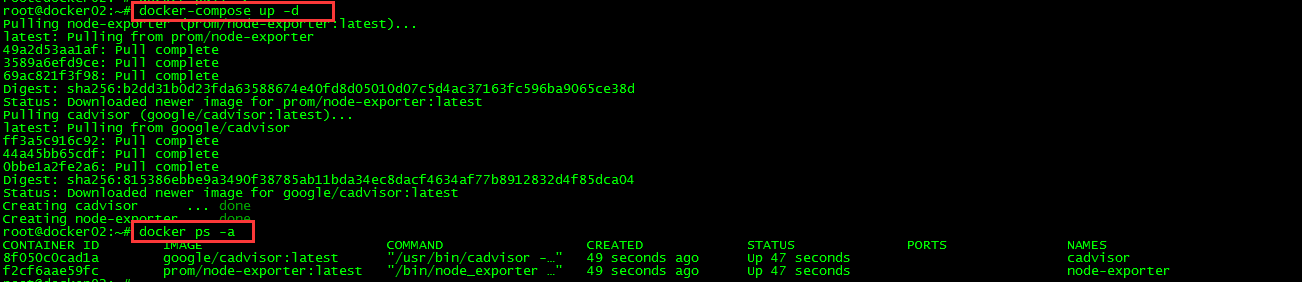
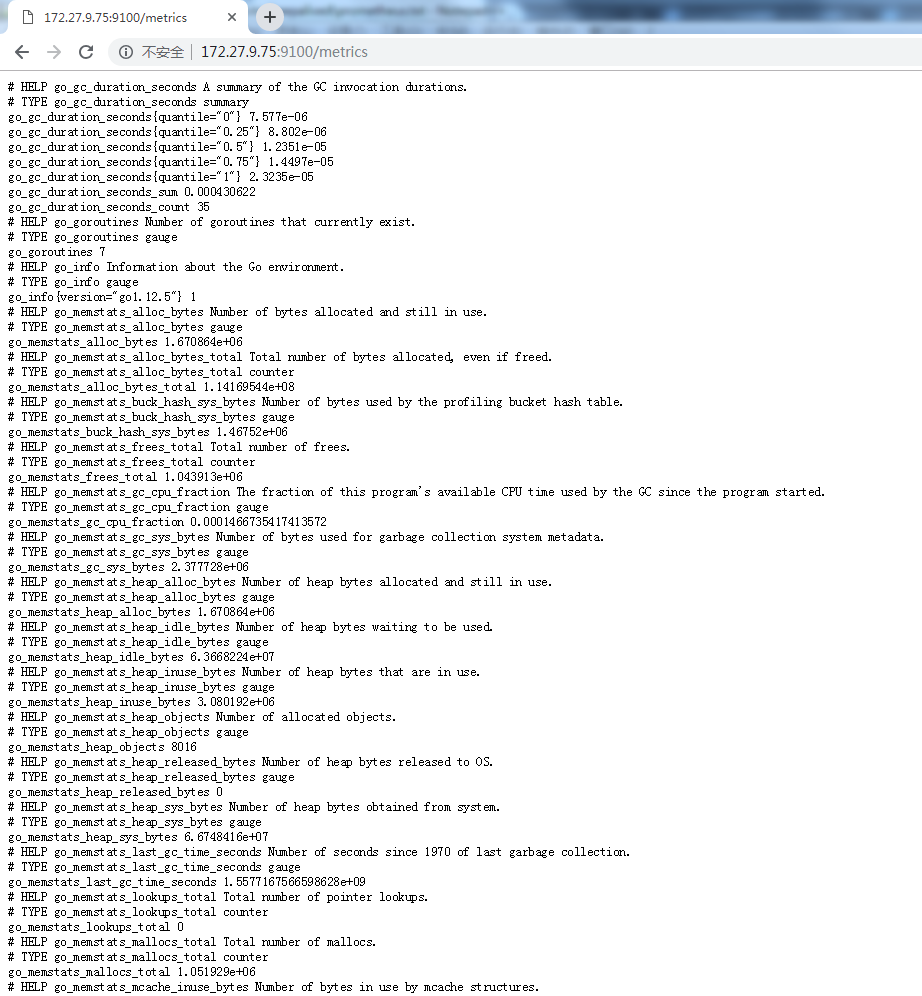
2.3 查看Node Exporter監控數據
http://172.27.9.75:8080/metrics
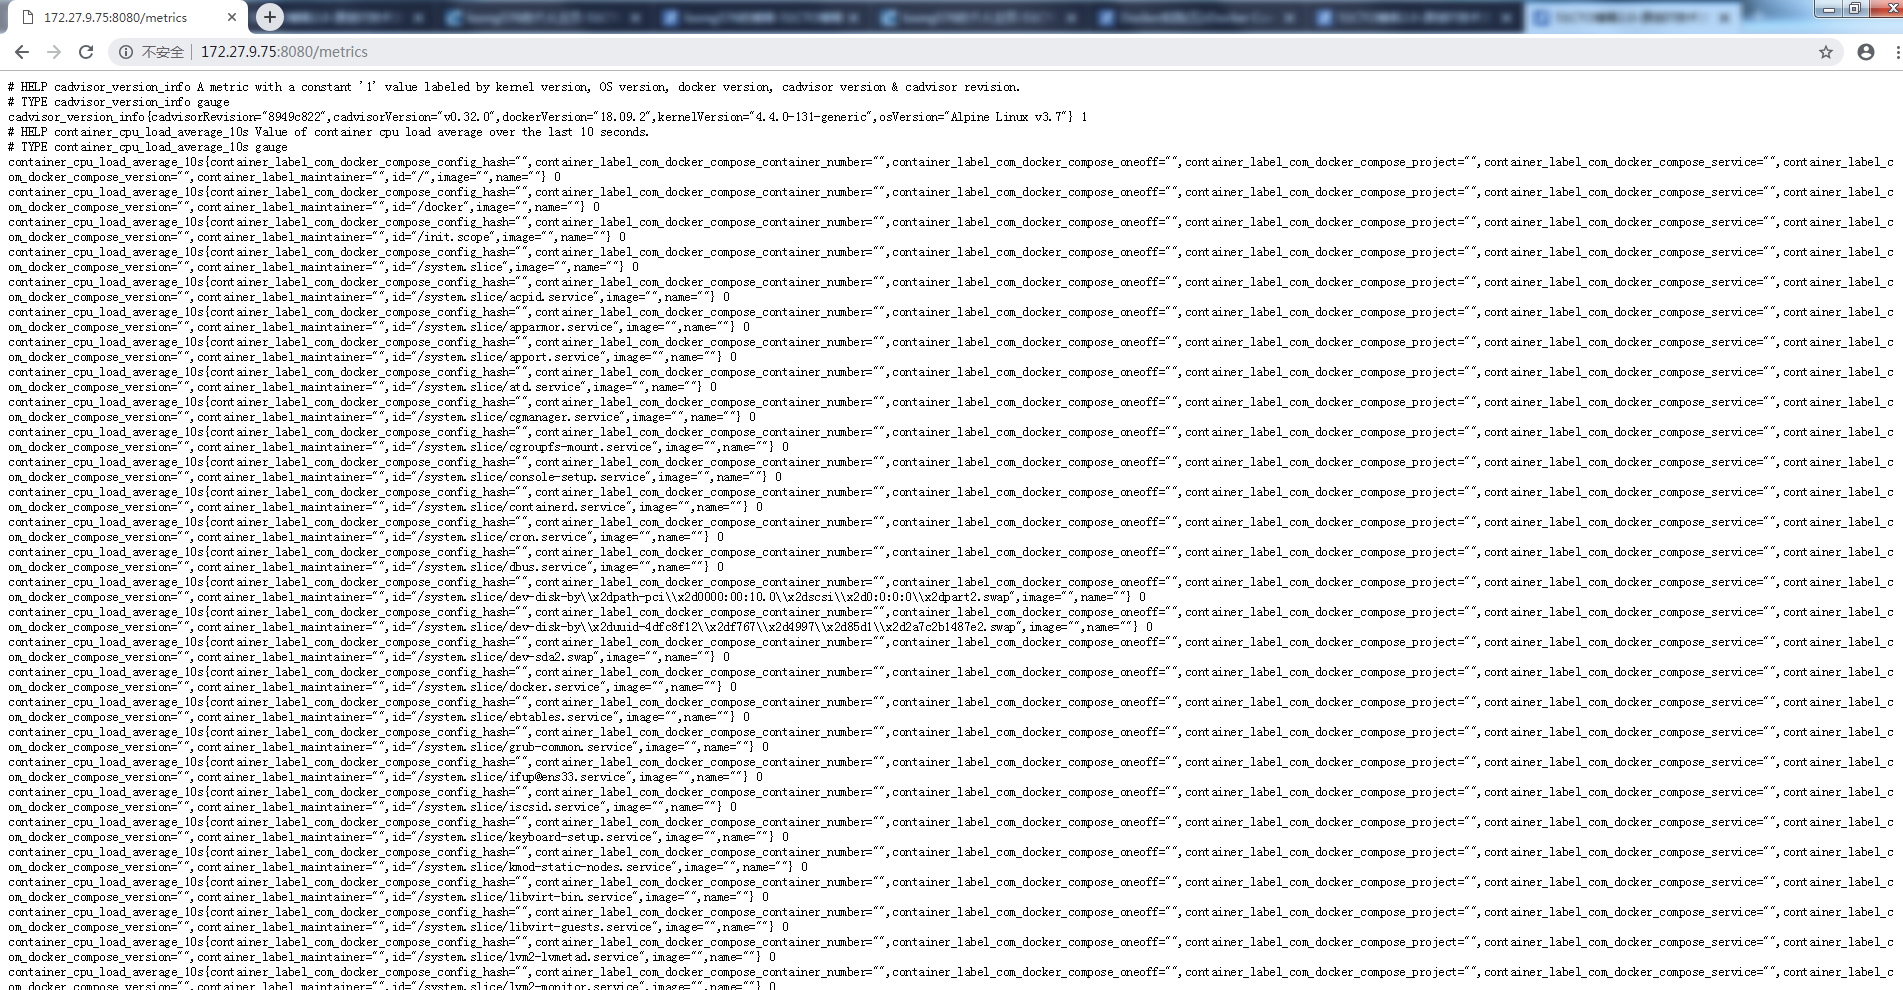
2.4 查看cAdvisor監控數據
http://172.27.9.75:8080/metrics
3. 監控服務器部署
3.1 prometheus.yml配置
root@docker01:~# more prometheus.yml
global:             # 全局設置,可以被覆蓋
  scrape_interval: 15s              # 抓取採樣數據的時間間隔,每15秒去被監控機上採樣,即數據採集頻率
  evaluation_interval: 15s          # 監控數據規則的評估頻率,比如設置文件系統使用率>75%發出告警則每15秒執行一次該規則,進行文件系統檢查
  external_labels:              # 與外部通信時用的外部標籤
    monitor: 'nodecontainer-monitor'

scrape_configs:             # 抓取配置
  - job_name: 'prometheus'              # 任務名,全局唯一
    scrape_interval: 5s             # 本任務的抓取間隔,覆蓋全局配置
    static_configs:             # 靜態目標配置
      # 抓取地址,路徑爲默認的/metrics
      - targets: ['localhost:9090','localhost:8080','localhost:9100','172.27.9.75:8080','172.27.9.75:9100']
3.2 docker-compose.yml配置
root@docker01:~# more docker-compose.yml
version: '3.7'
services:
prometheus:
image: prom/prometheus:latest
network_mode: 'host'
container_name: prometheus
restart: unless-stopped
ports:
- '9090:9090'
volumes:
- /root/prometheus.yml:/etc/prometheus/prometheus.yml
depends_on:
- cadvisor
node-exporter:
image: prom/node-exporter:latest
network_mode: 'host'
container_name: node-exporter
restart: unless-stopped
ports:
- '9100:9100'
command:
- '--path.procfs=/host/proc'
- '--path.sysfs=/host/sys'
- '--collector.filesystem.ignored-mount-points=^/(sys|proc|dev|host|etc)($$|/)'
volumes:
- /proc:/host/proc
- /sys:/host/sys
- /:/rootfs
cadvisor:
image: google/cadvisor:latest
network_mode: 'host'
container_name: cadvisor
restart: unless-stopped
ports:
- '8080:8080'
volumes:
- /:/rootfs:ro
- /var/run:/var/run:rw
- /sys:/sys:ro
- /var/lib/docker/:/var/lib/docker:ro
grafana:
image: grafana/grafana:latest
network_mode: 'host'
container_name: grafana
restart: unless-stopped
ports:
- '3000:3000'
user: '0'
volumes:
- ./data/grafana:/var/lib/grafana
environment:
- GF_SECURITY_ADMIN_PASSWORD=admin
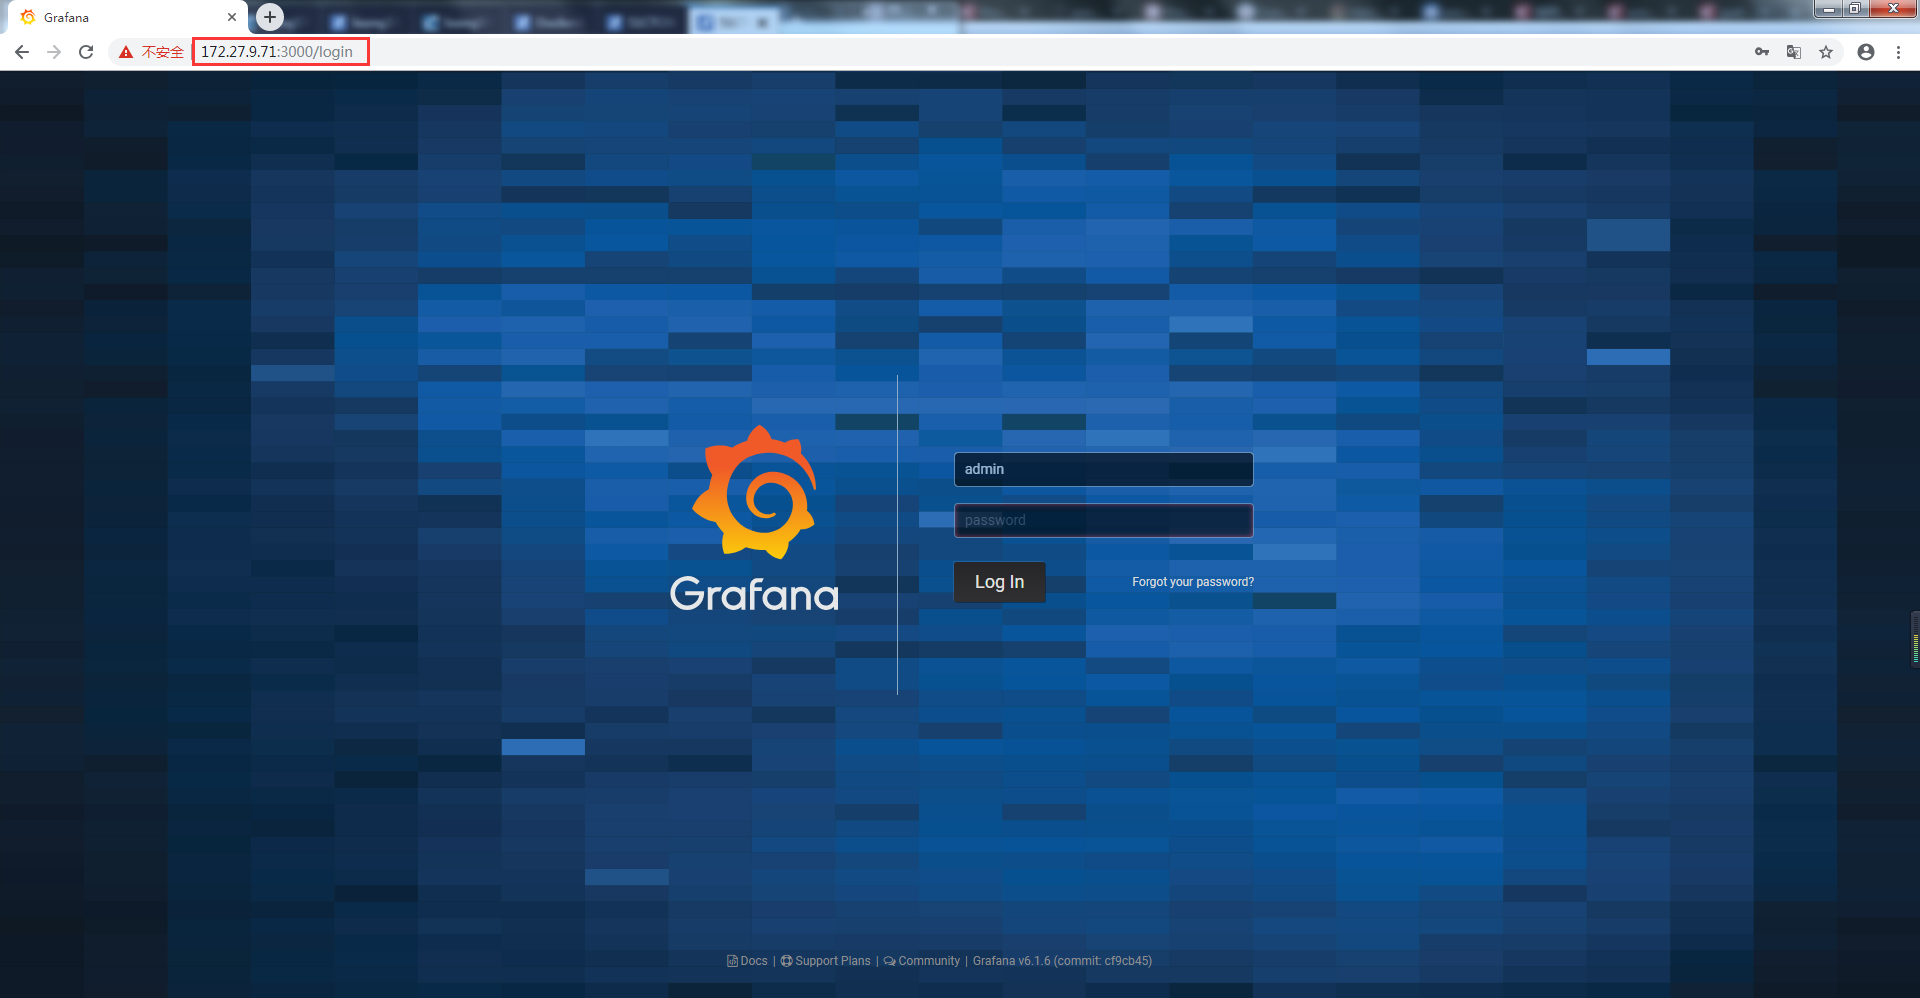
- GF_SERVER_ROOT_URL=http://172.27.9.71:3000grafana登陸地址爲http://172.27.9.71:3000 ,密碼爲admin,容器grafana要以root用戶執行,否則會報權限錯誤。
3.3 運行docker-compose
root@docker01:~# docker-compose up -d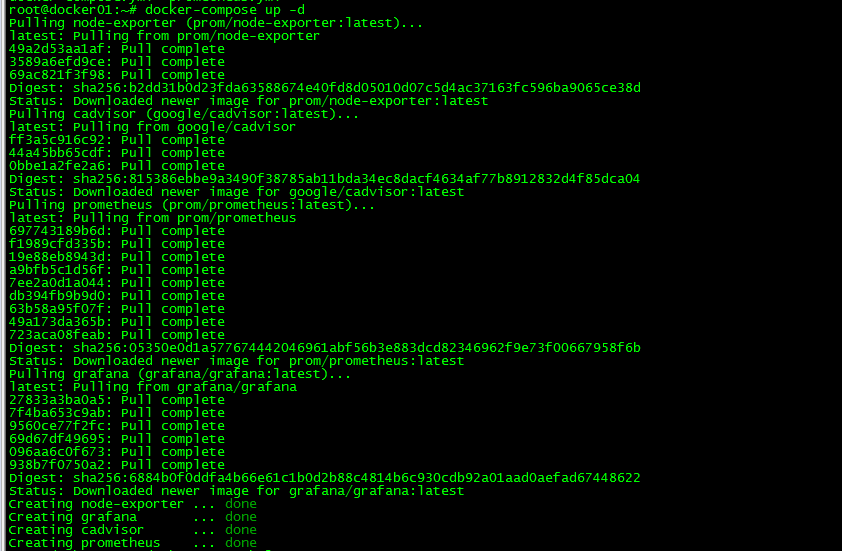

3.4 查看Prometheus監控數據
3.4.1 配置文件查看
http://172.27.9.71:9090/config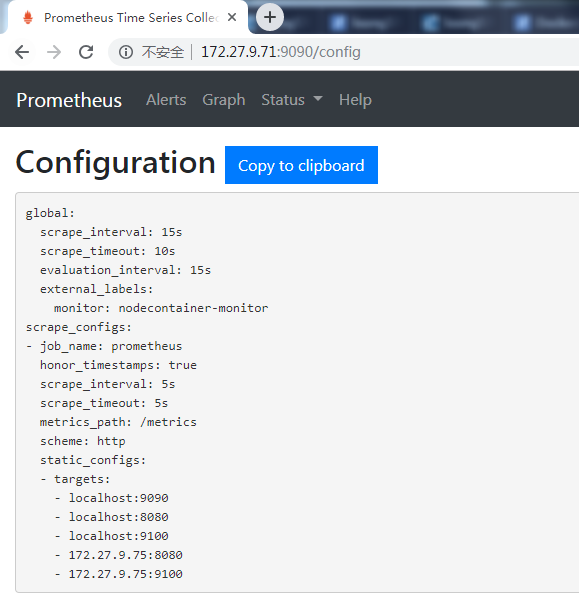
3.4.2 監控信息查看
http://172.27.9.71:9090/metrics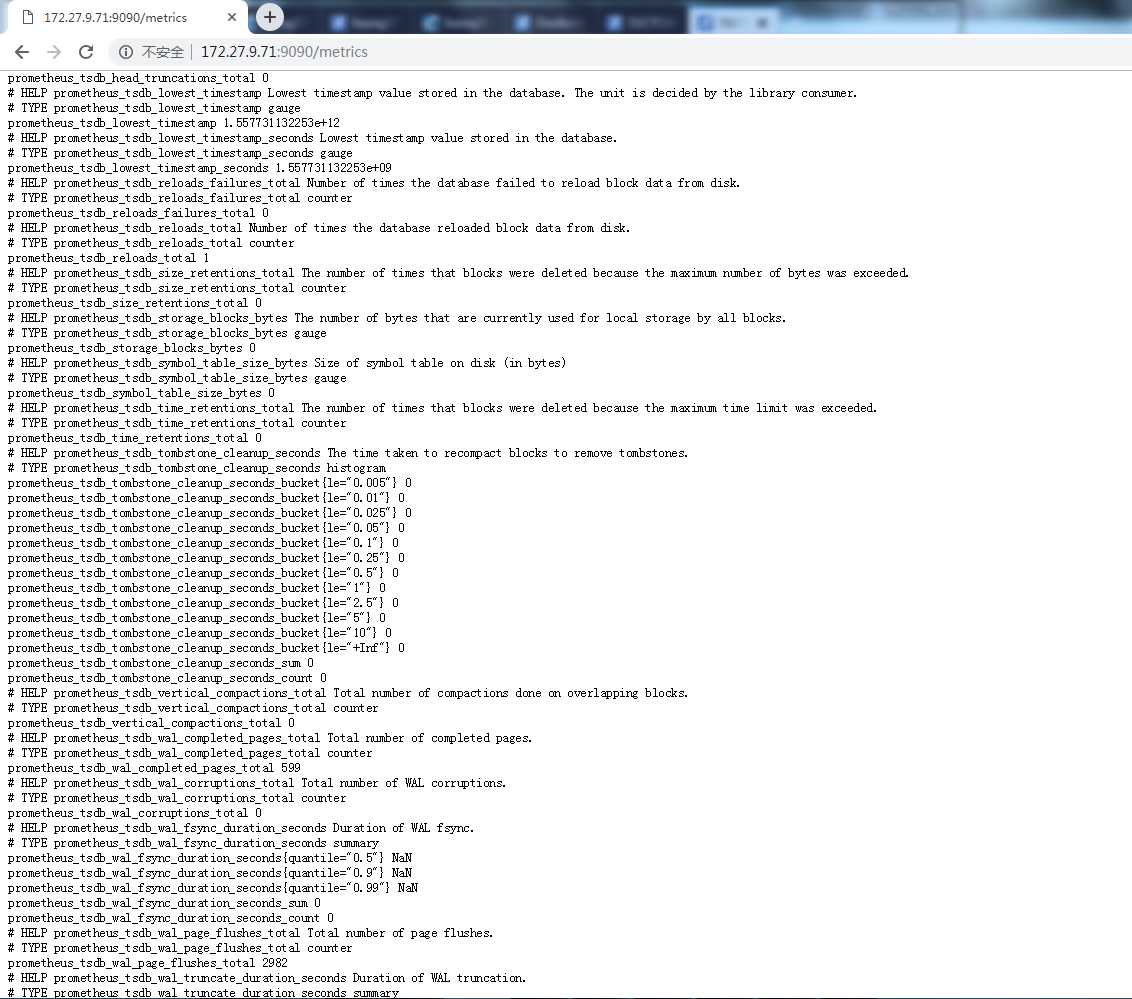
3.4.3 查看指定監控項
http://172.27.9.71:9090
比如查看cpu五分鐘負載
四、Grafana配置
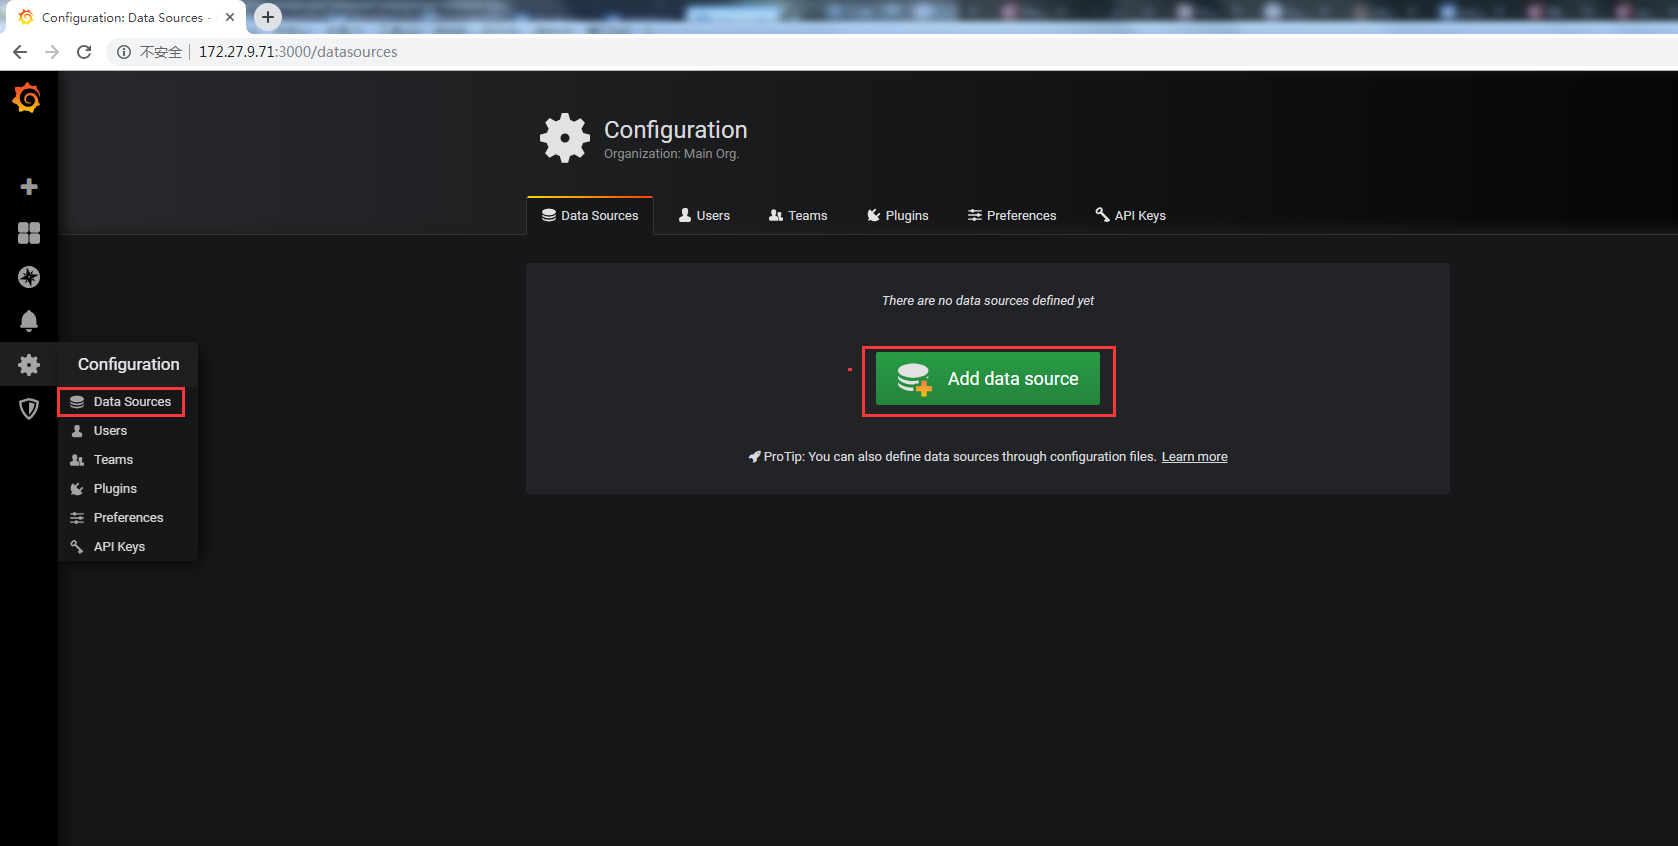
1. 登陸grafana
2. 添加DataSource
選擇Prometheus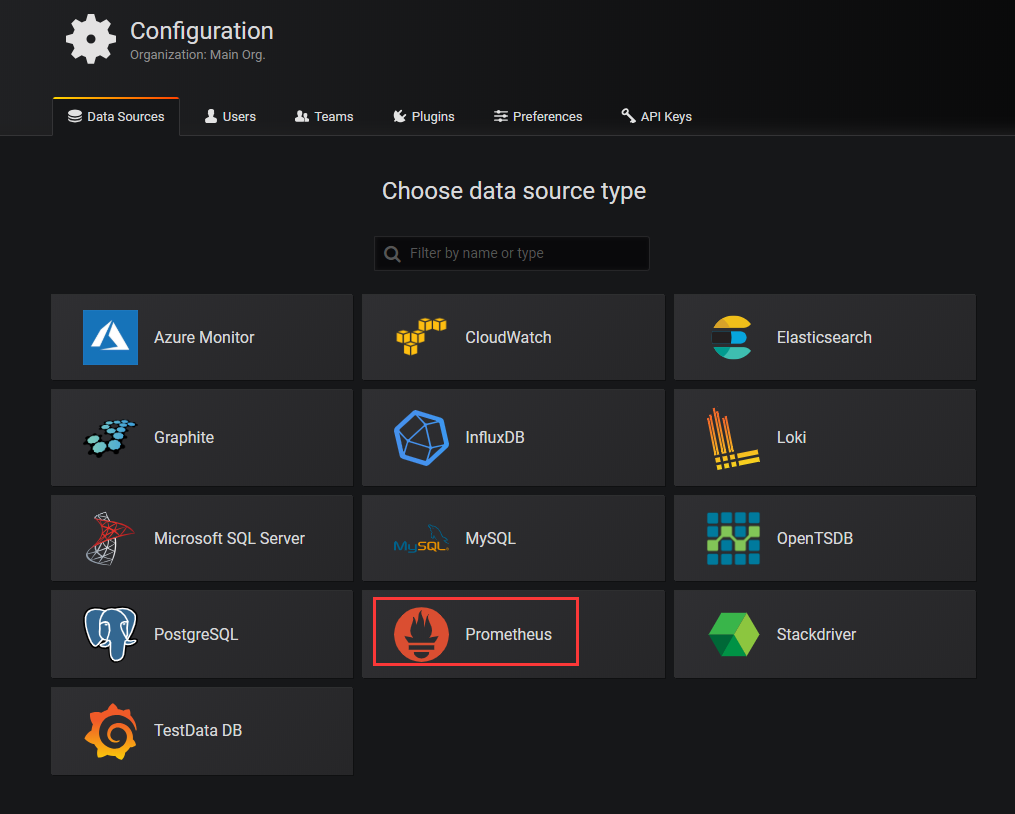
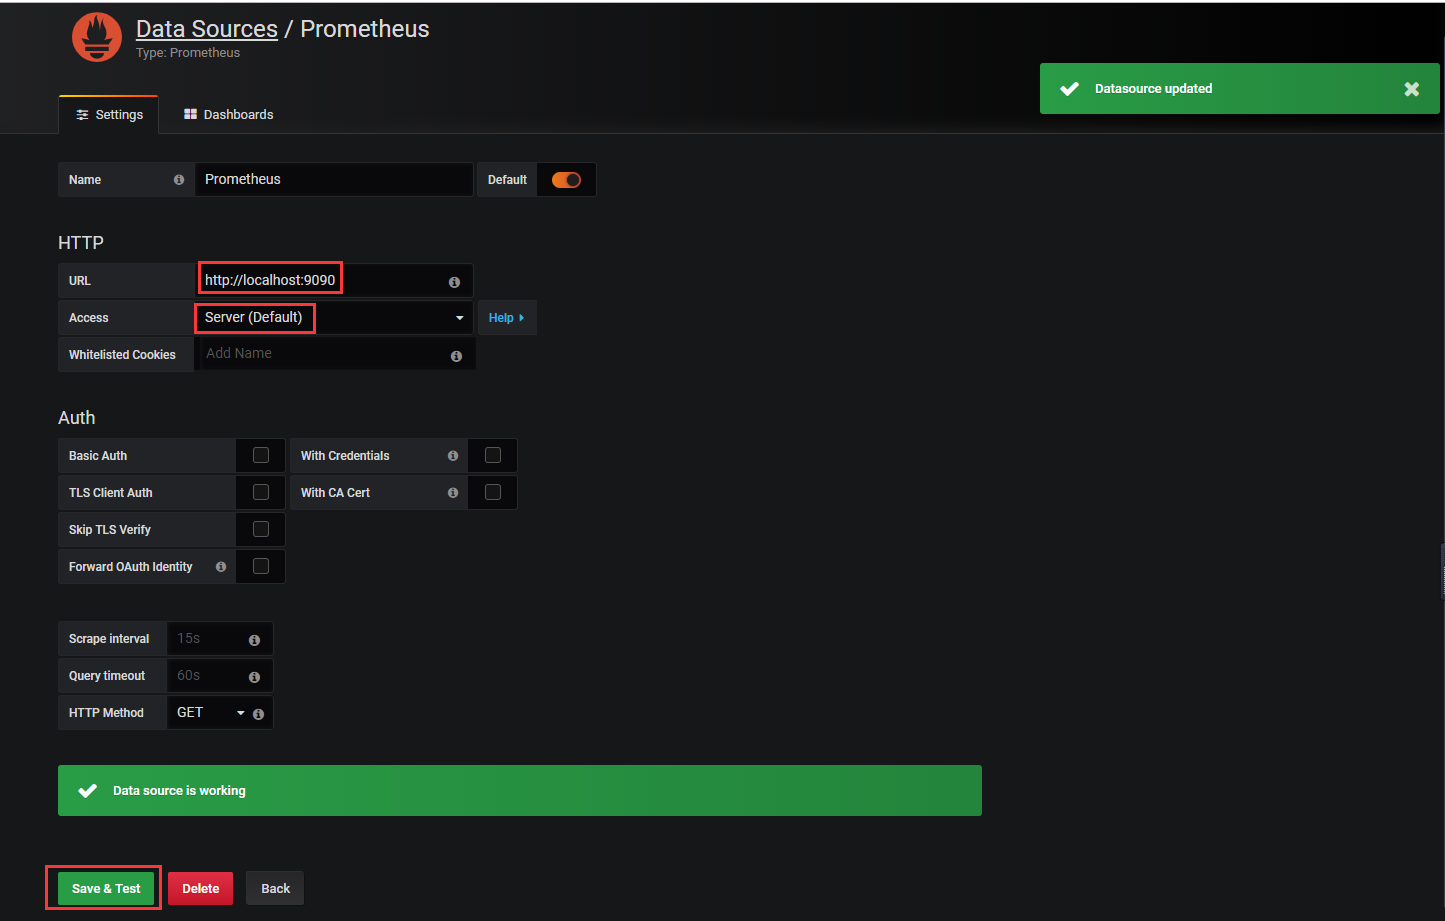
配置DataSource
3. Dashboards配置
3.1 下載Dashboards
下載鏈接:https://grafana.com/dashboards?dataSource=prometheus&category=docker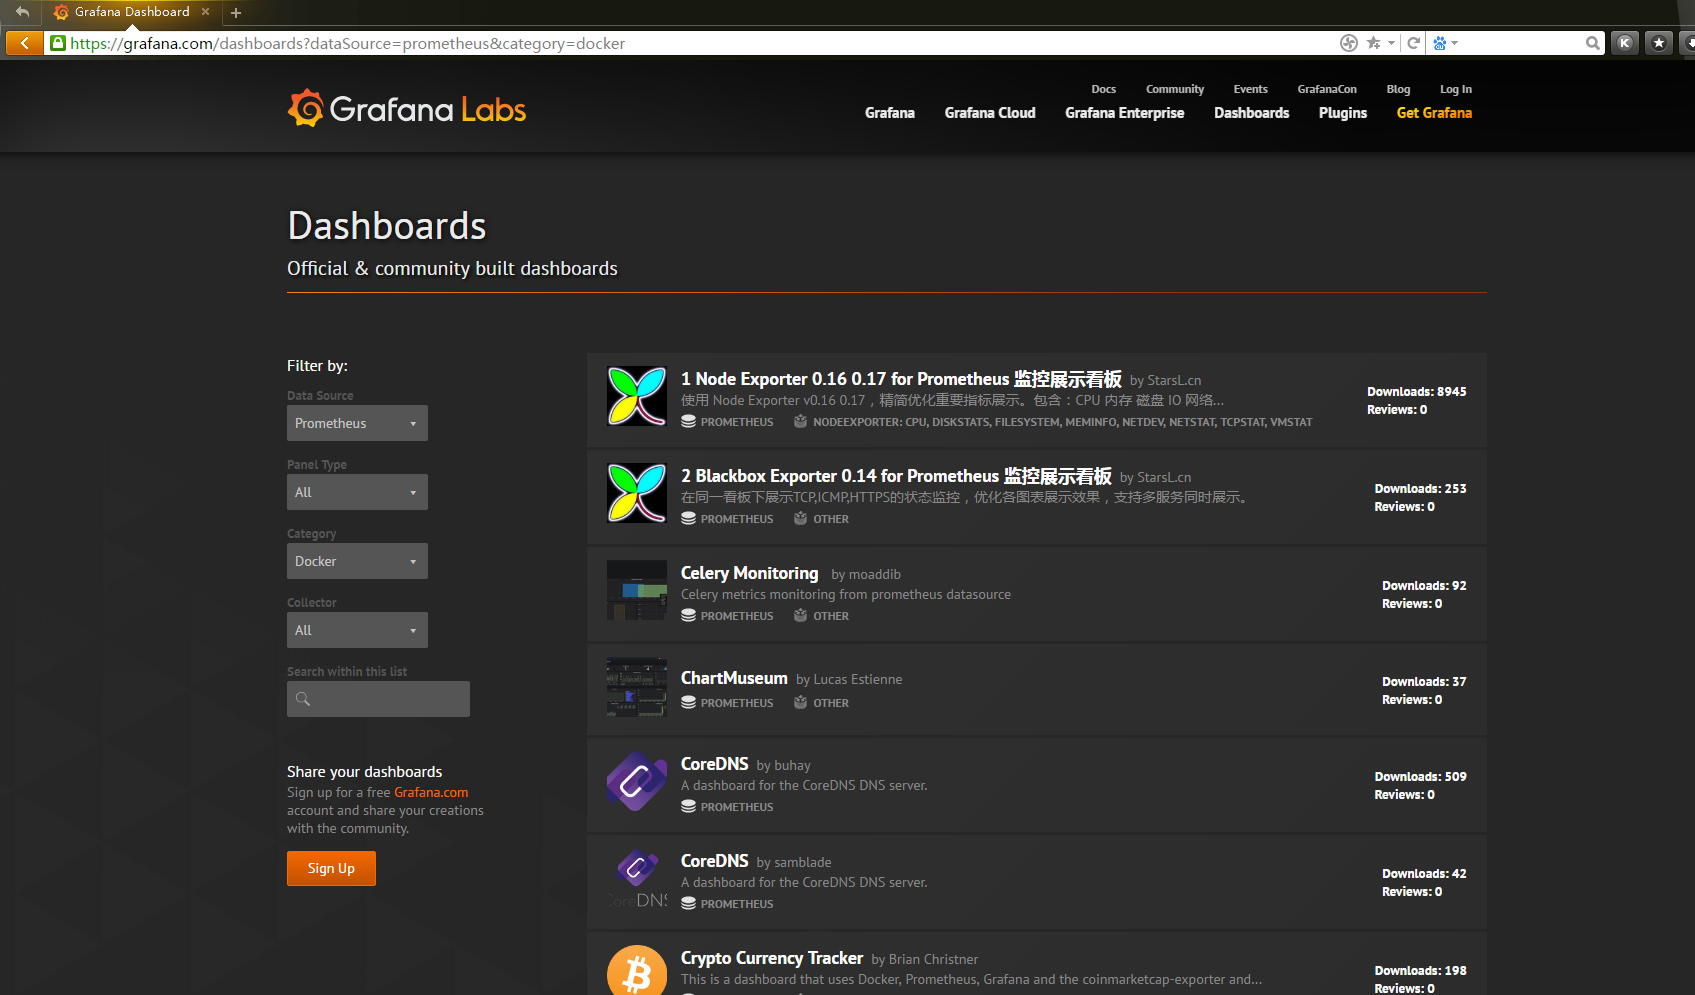
3.2 導入 Dashboards
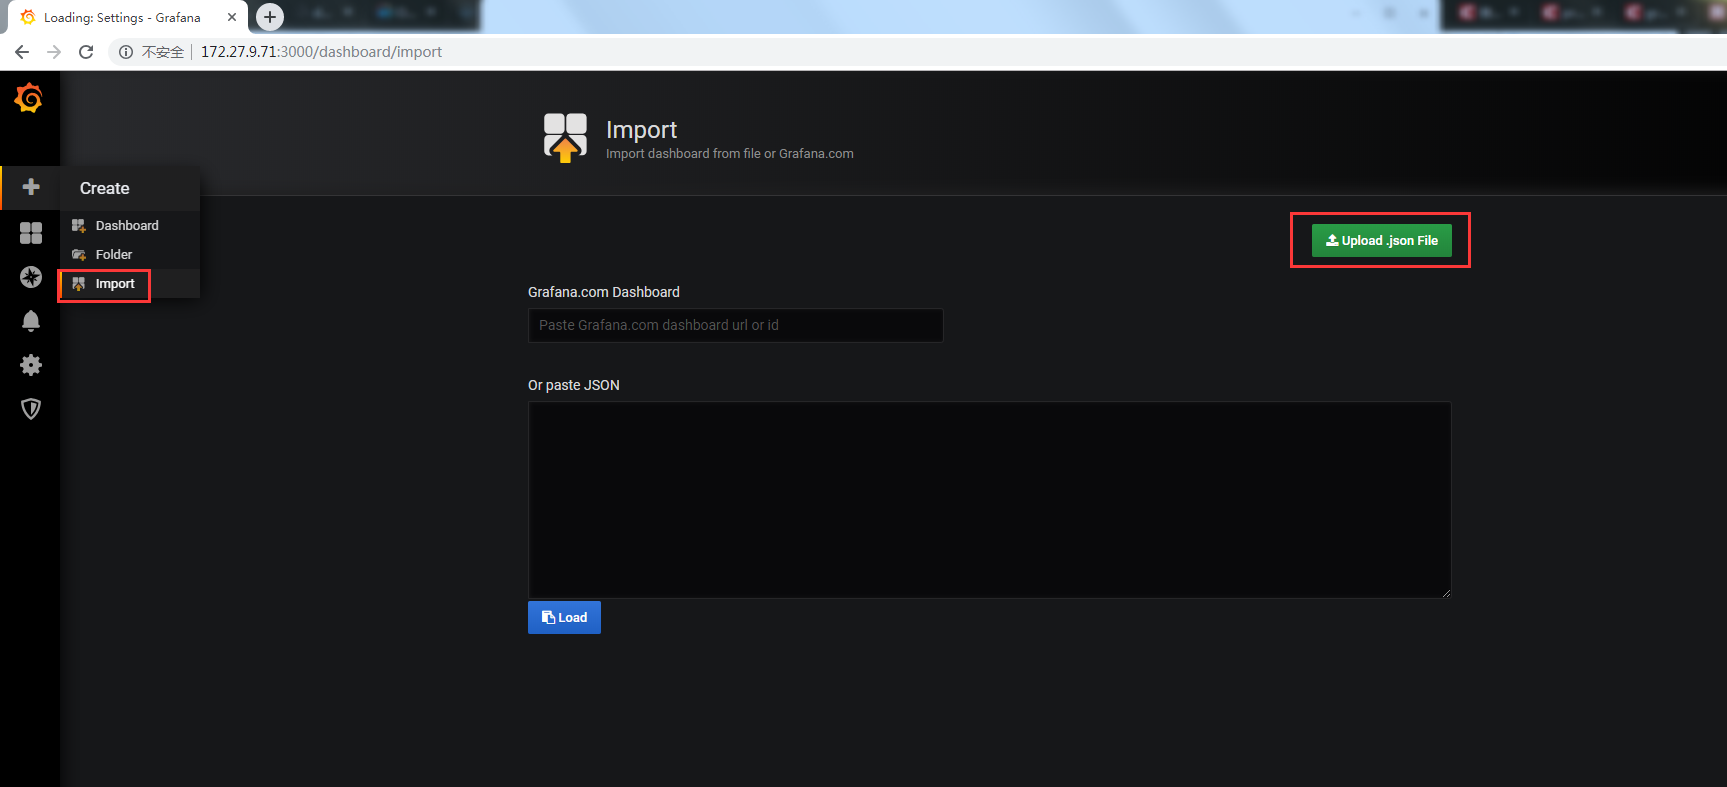
分別導入docker-monitoring_rev1.json和node-exporter-full_rev13.json用於展示container和host的監控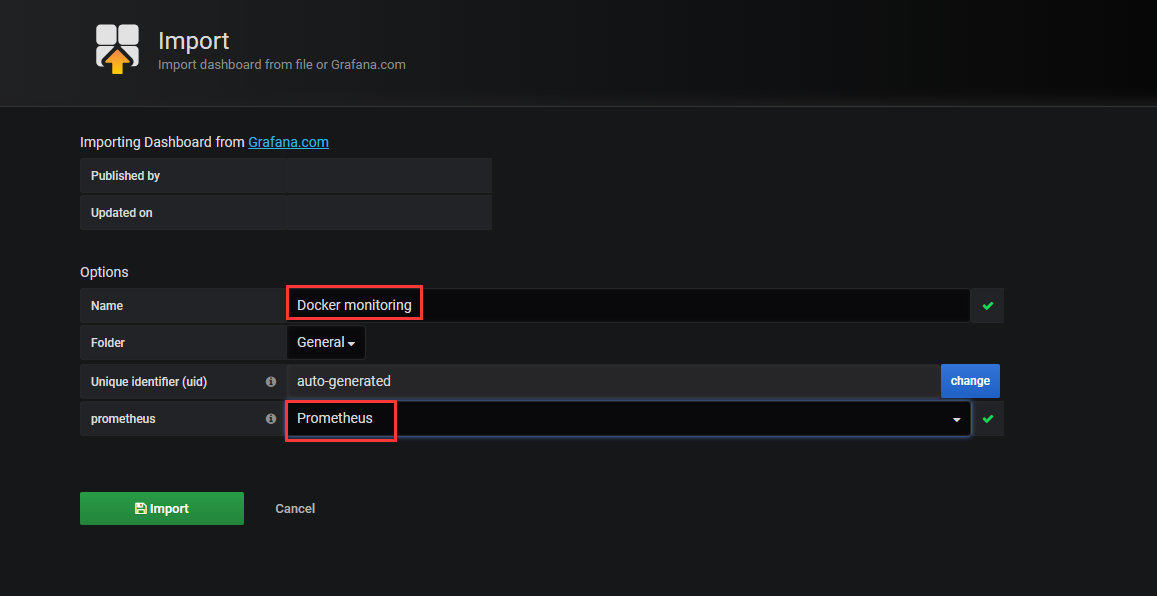
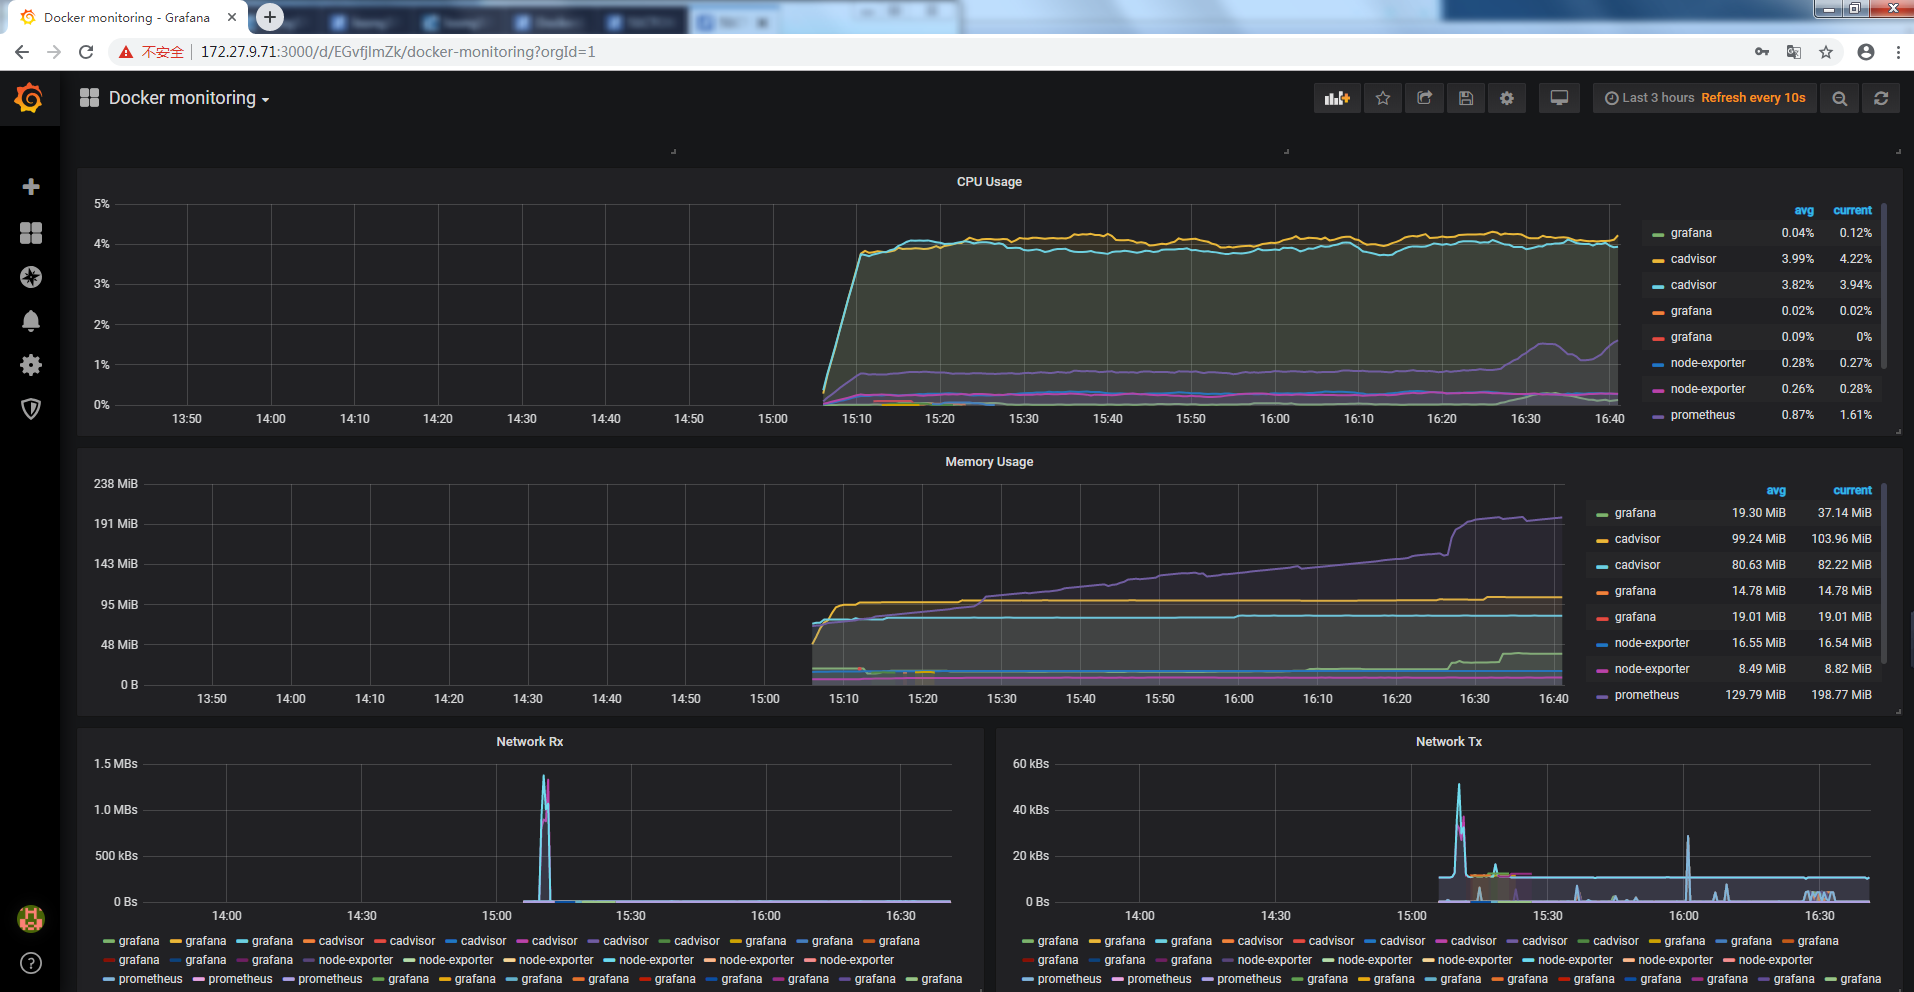
4. Grafana監控展示
4.1 容器監控展示
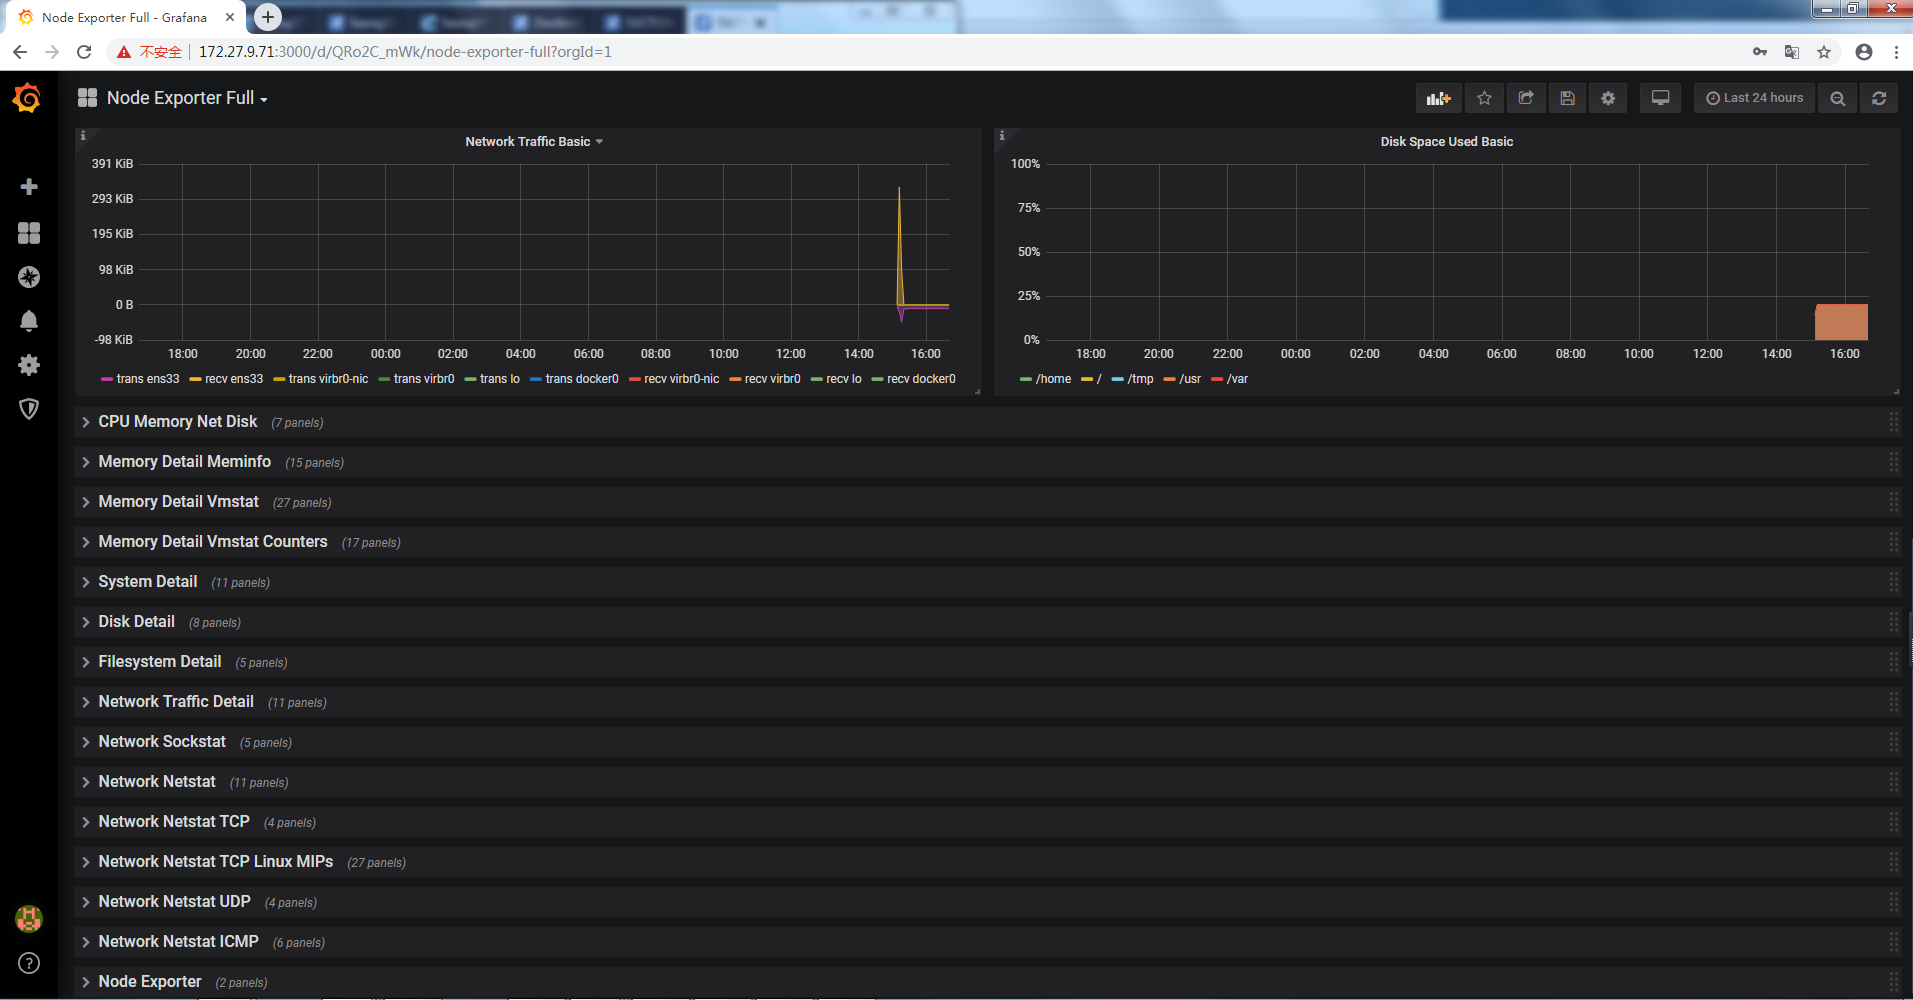
4.2 host監控展示

五、釘釘告警配置
1. 釘釘添加機器人
釘釘通過機器人來接收告警信息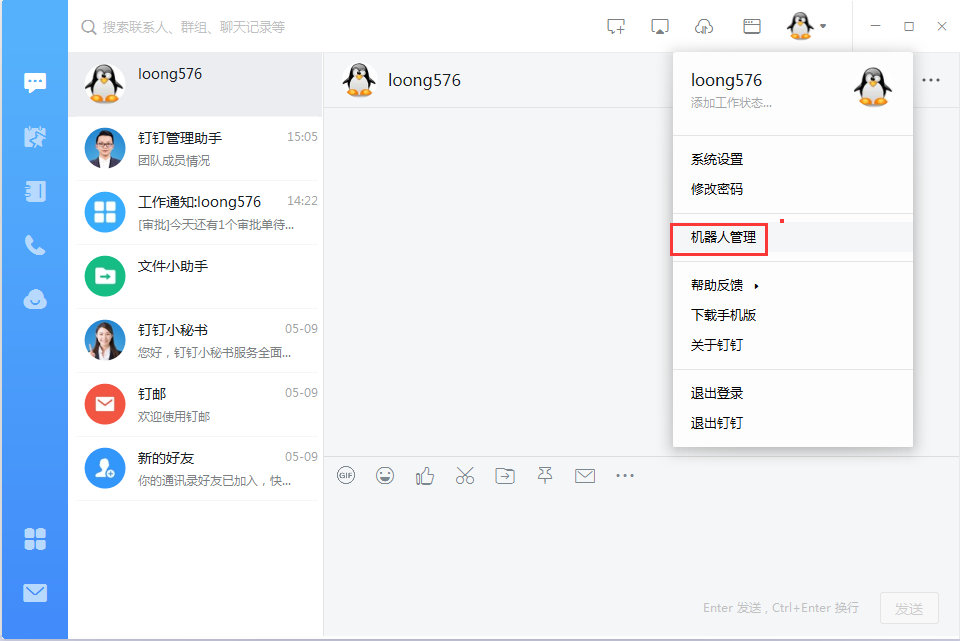
選擇自定義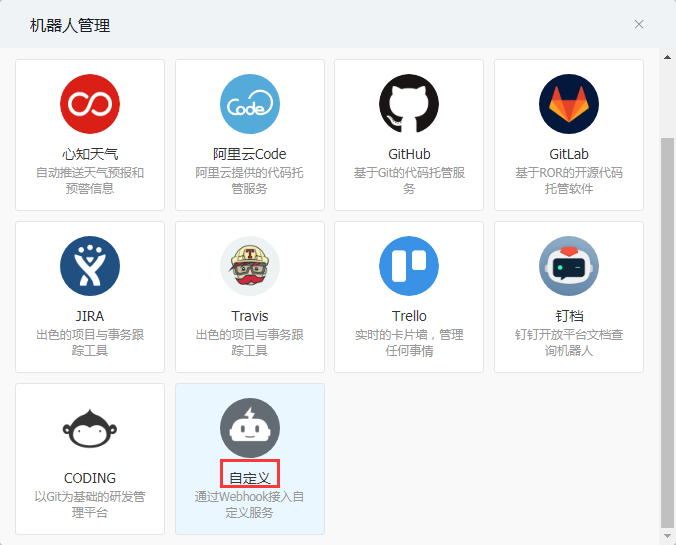
添加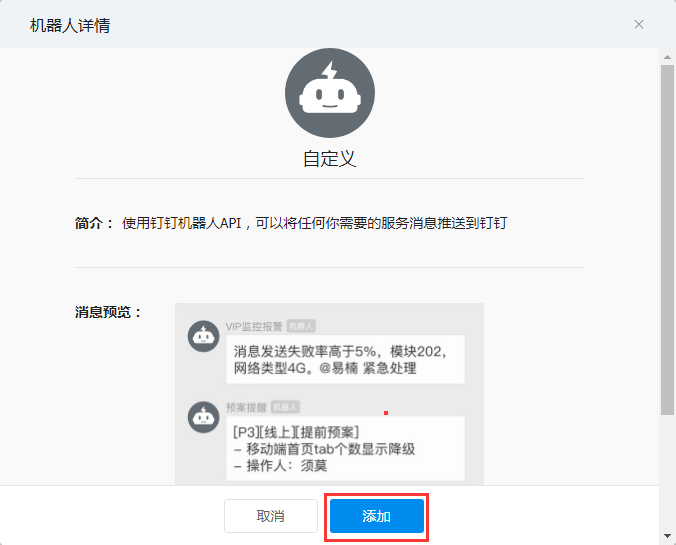
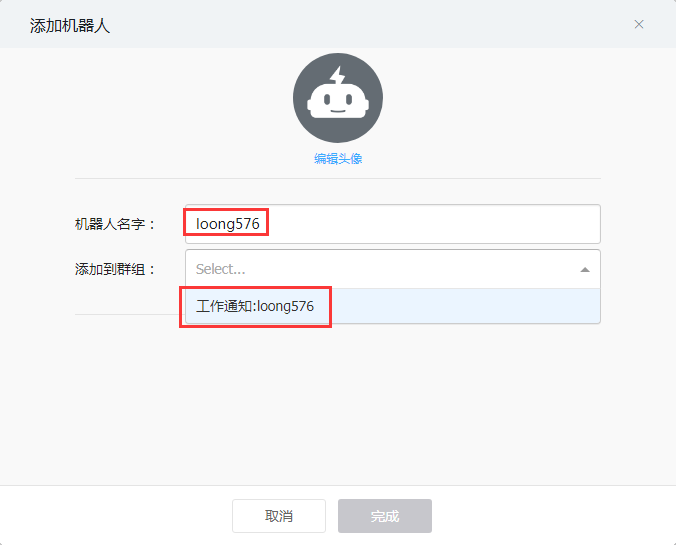
機器人名稱自定義爲:loong576,添加到工作通知loong576,也可以添加到羣
複製webhook,完成機器人添加
2. Grafana新增告警項
新增告警通道DingDing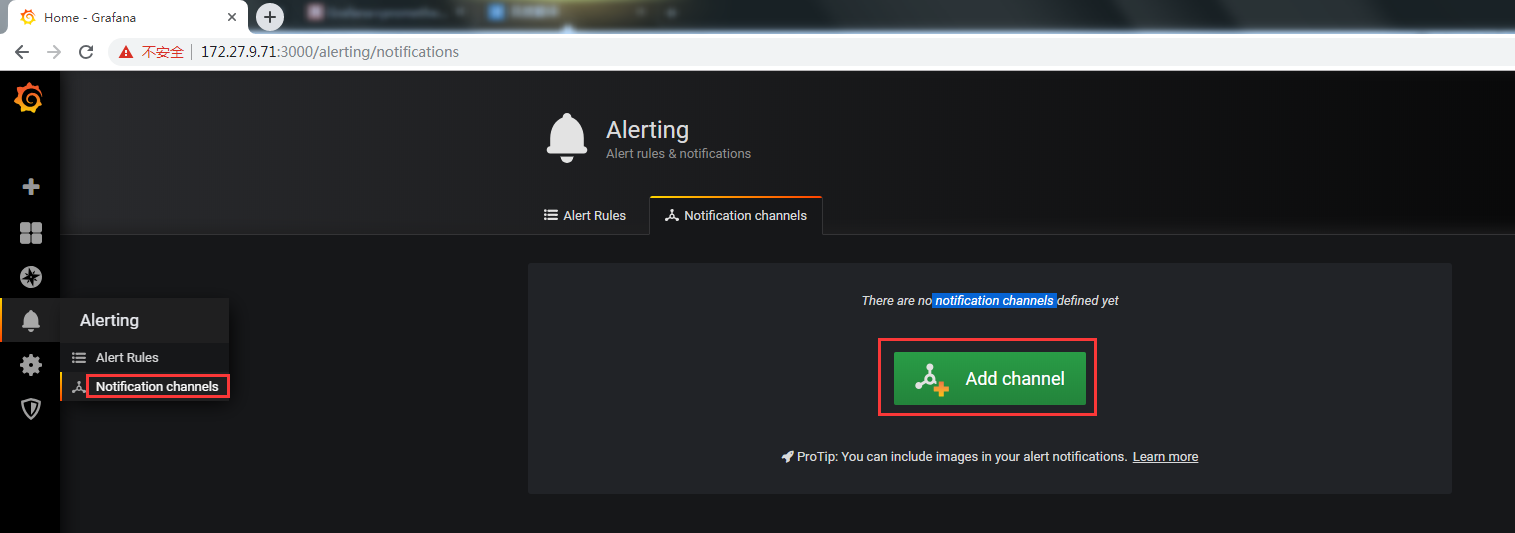
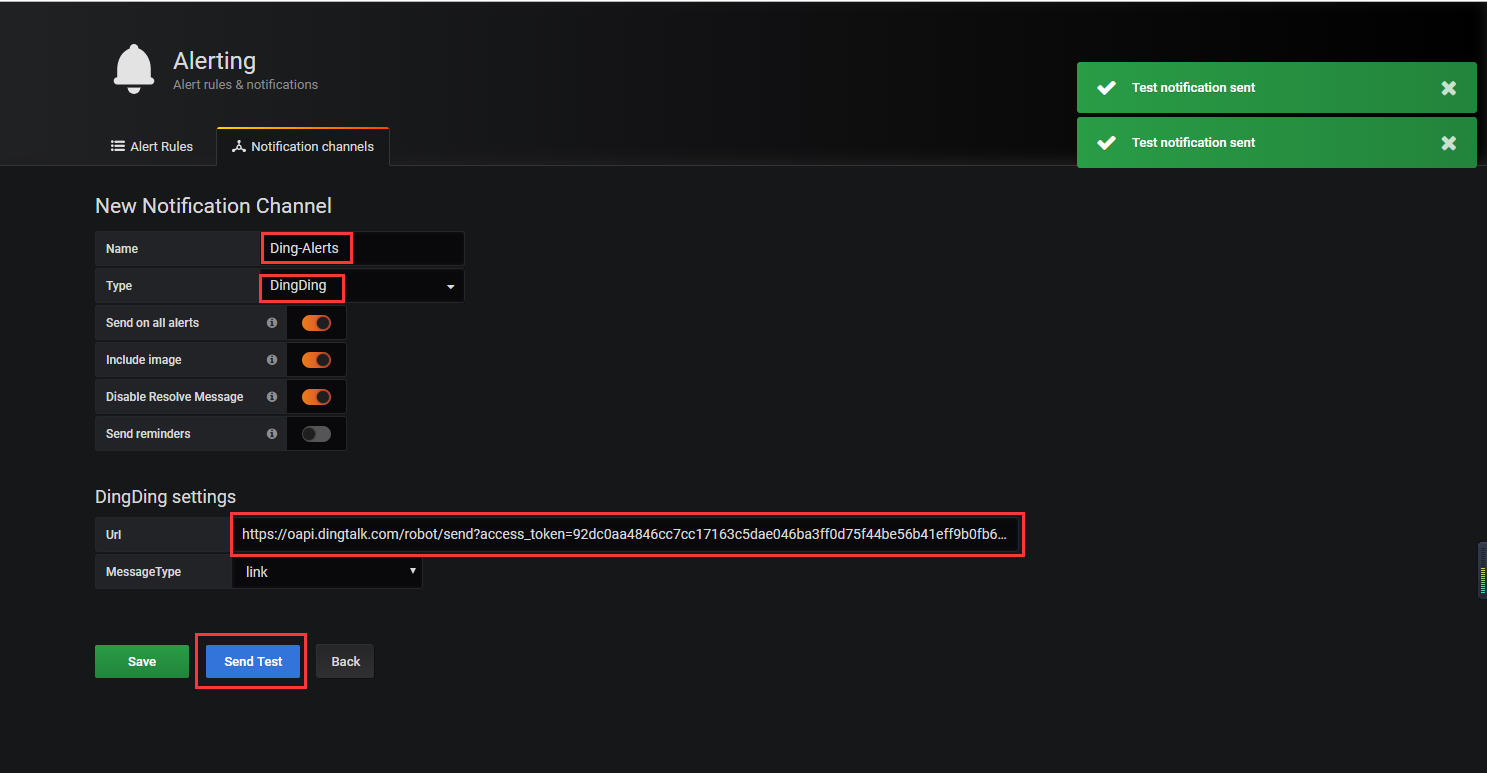
Name爲自定義Ding-Alerts,Type選擇DingDing,url爲之前複製的webhook,測試正常,保存
3. 新增告警項
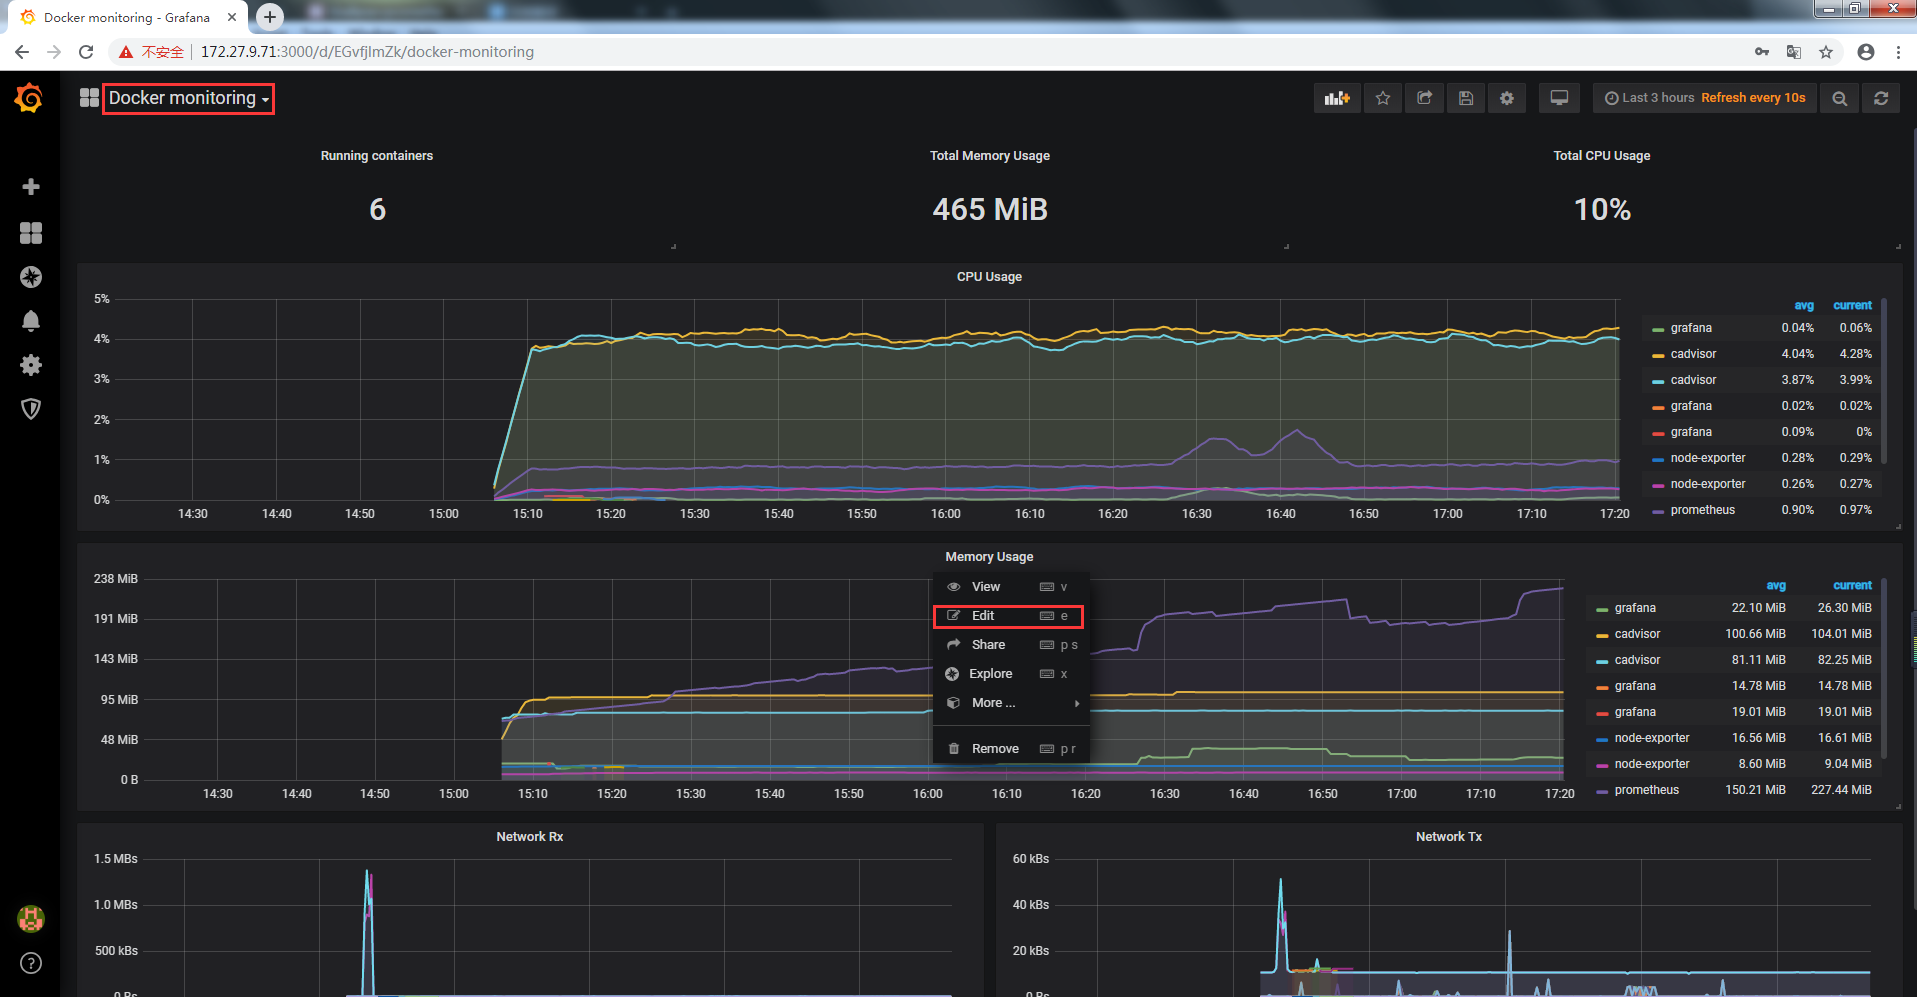
本文以監控容器內存使用率爲例介紹grafana如何通過釘釘機器人發送告警信息
3.1 編輯Memory Usage
3.2 創建Alert
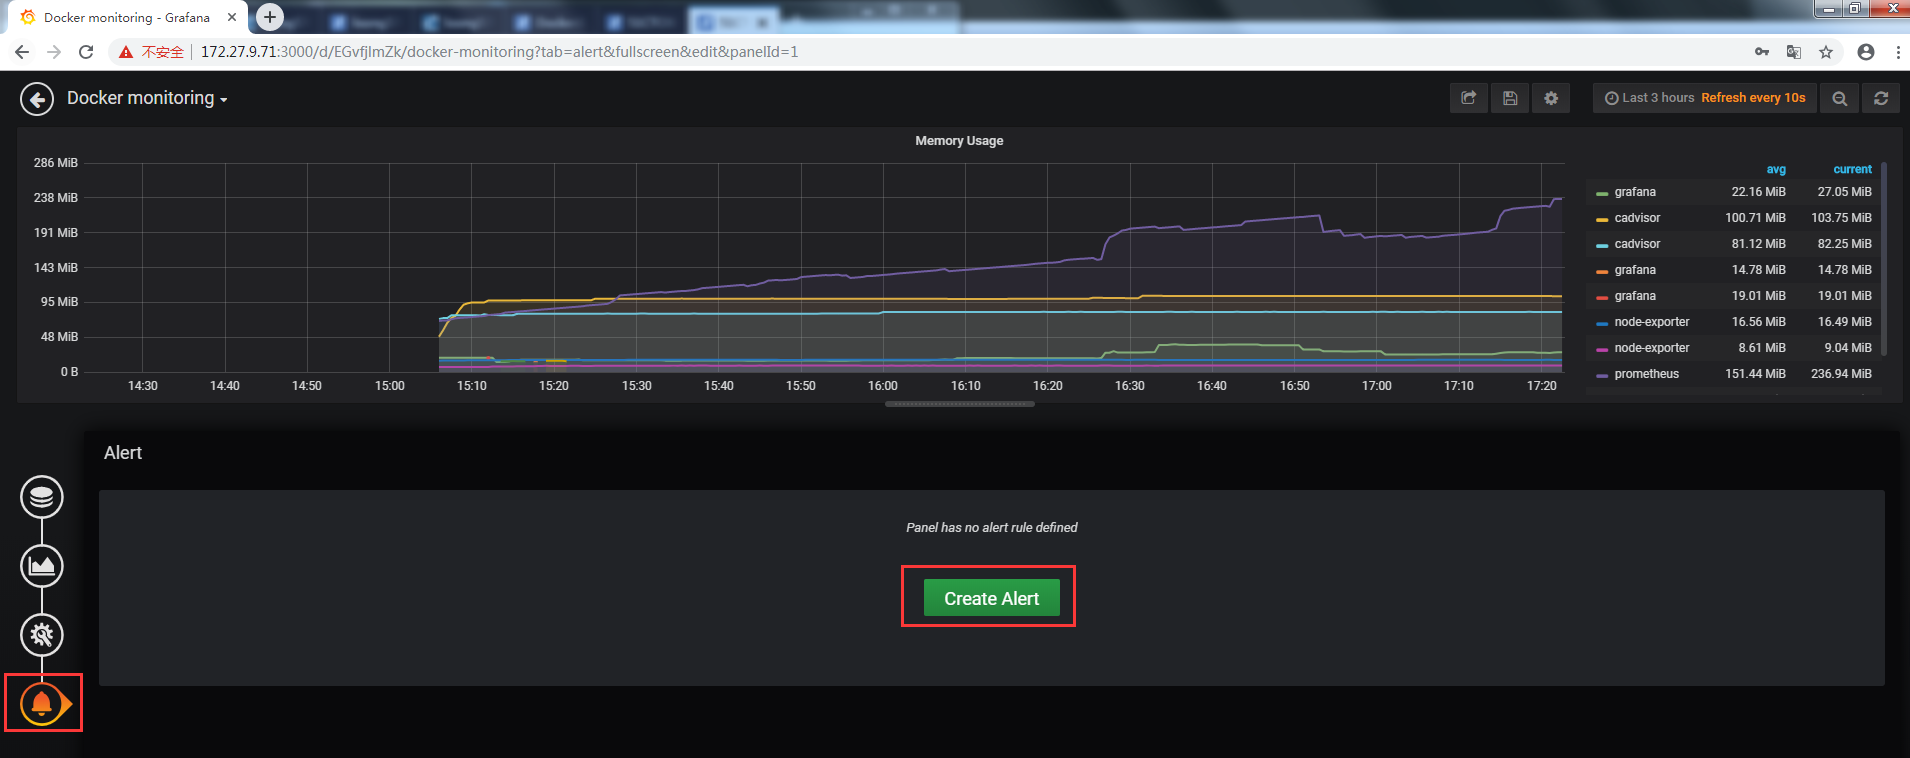
3.3 Alert配置
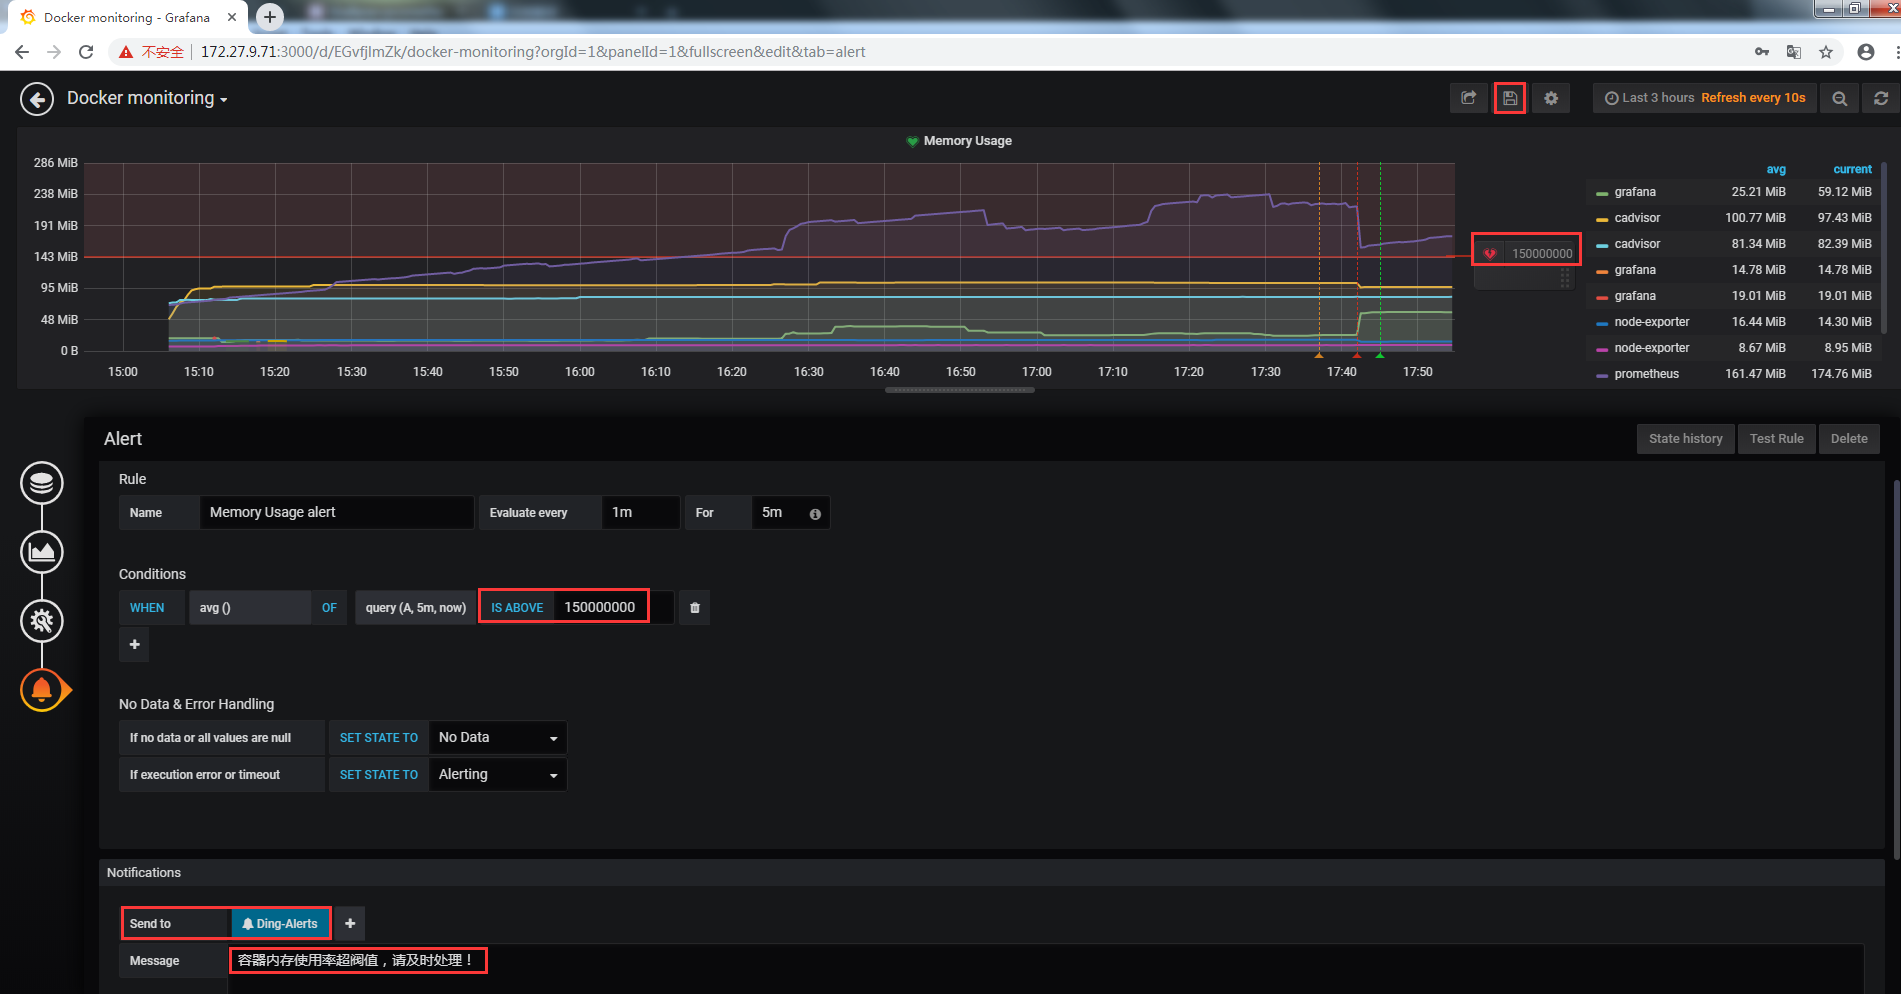
當容器內存使用率大於150M時發送告警信息
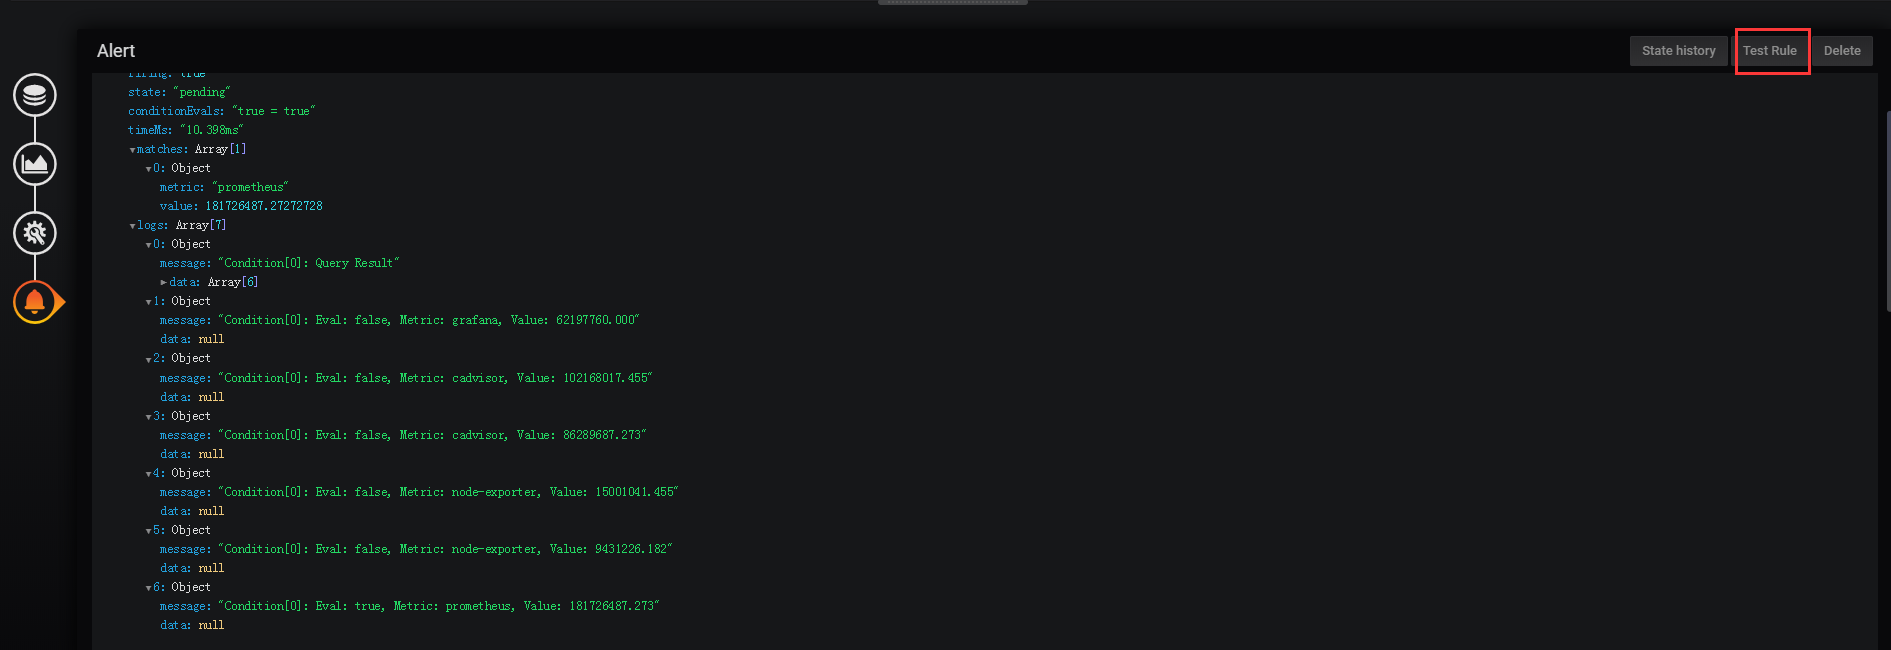
3.4 驗證告警配置
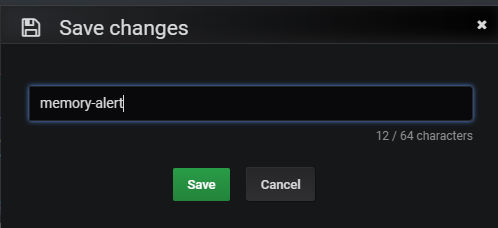
3.5 保存告警配置
3.6 告警信息查看
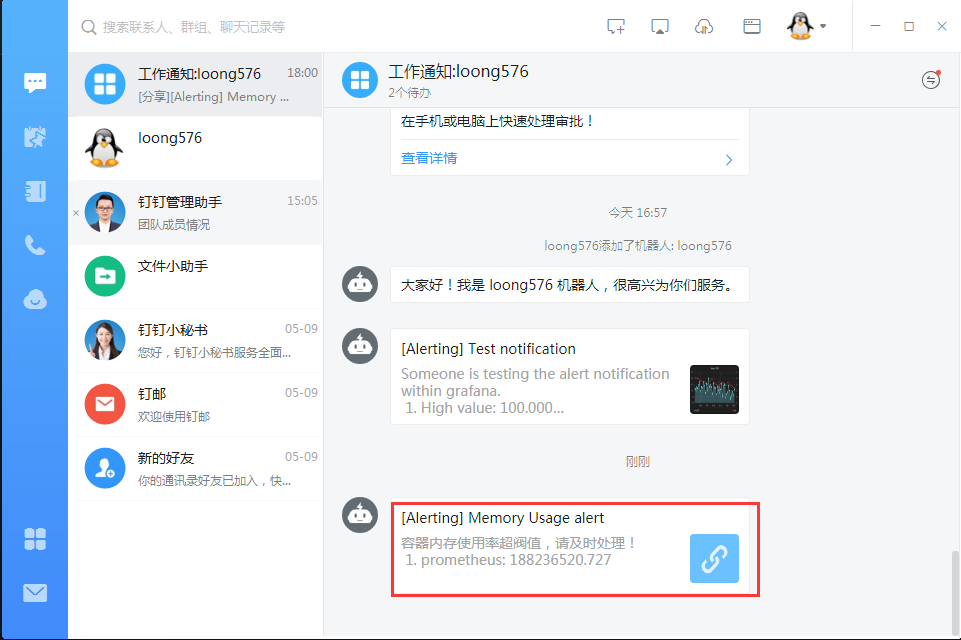
手機端也會同步收到告警信息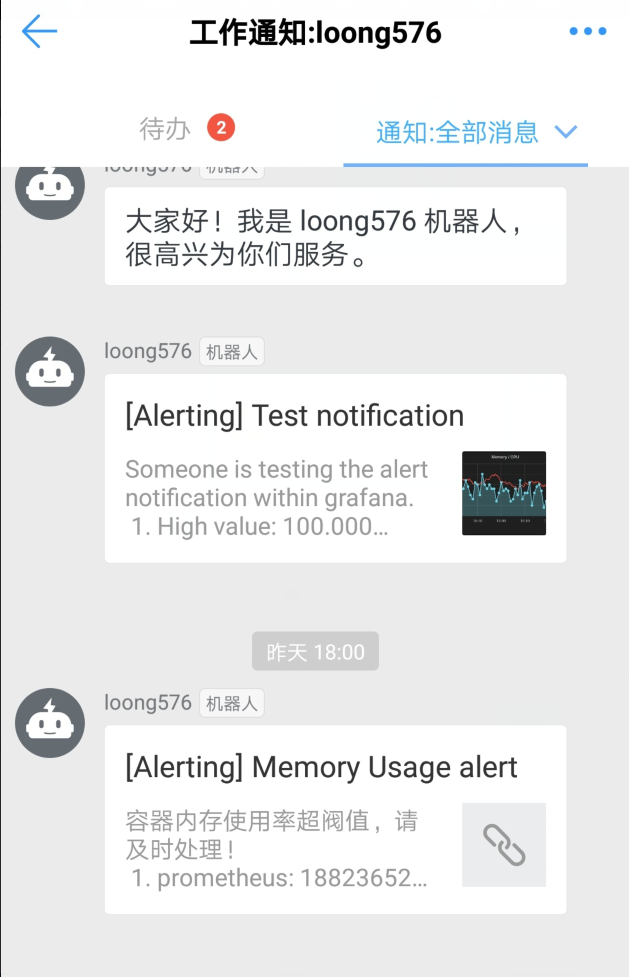
至此完成釘釘告警信息的發送,當然,也可以新增dashboard,選擇Graph方式自定義展示和告警項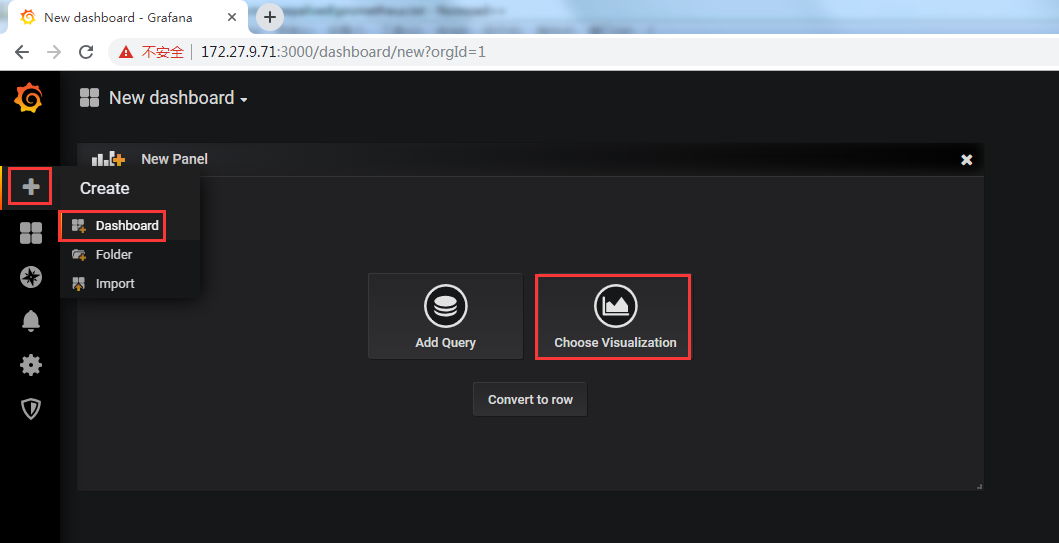
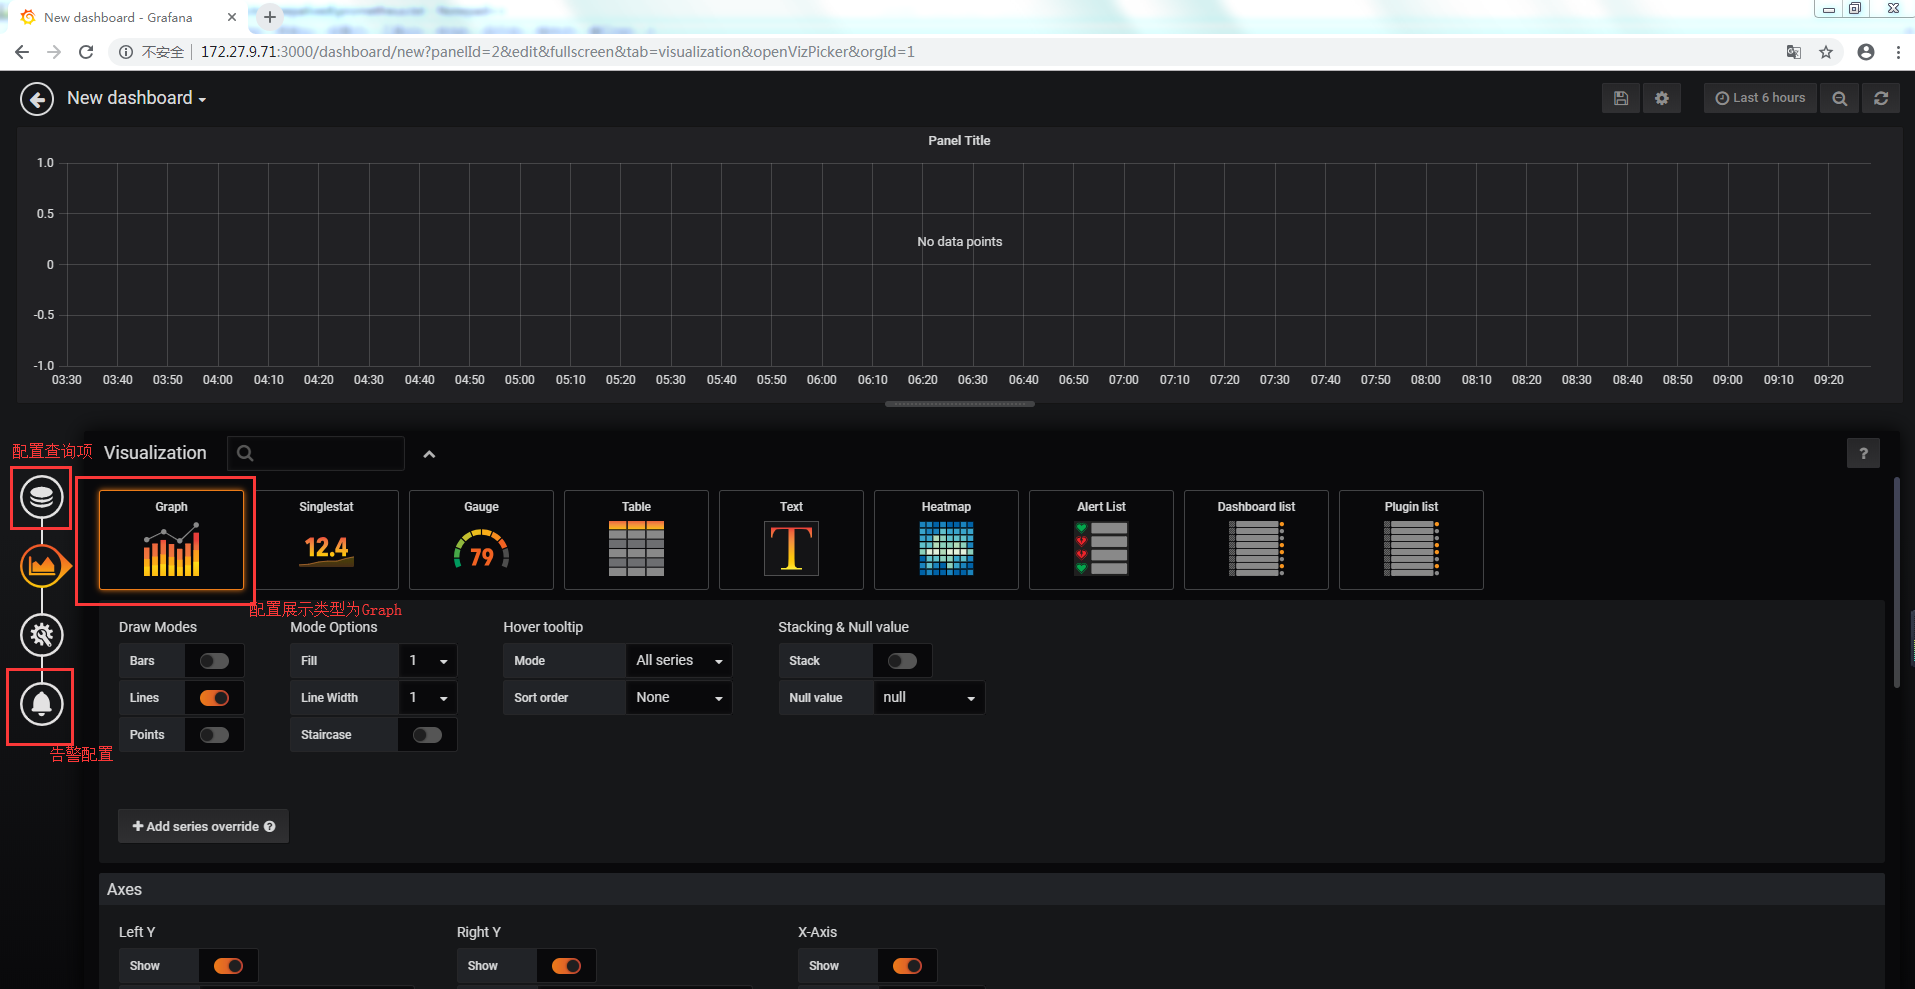
目前Grafana只支持Graph添加報警規則,有一定侷限性。
docker-compose和prometheus配置文件已上傳github:https://github.com/loong576/prometheus.git
本文參考:
1.https://grafana.com/docs/features/datasources/prometheus/;
2.https://prometheus.io/docs/introduction/overview/;
3.https://open-doc.dingtalk.com/microapp/serverapi2/qf2nxq;
4.https://docs.docker.com/compose/reference/overview/