


什麼是prometheus?
Prometheus 是由 SoundCloud 開源監控告警解決方案,從 2012 年開始編寫代碼,再到 2015 年 github 上開源以來,已經吸引了 9k+ 關注,以及很多大公司的使用;2016 年 Prometheus 成爲繼 k8s 後,第二名 CNCF(Cloud Native Computing Foundation) 成員。
主要功能:
多維 數據模型(時序由 metric 名字和 k/v 的 labels 構成)。
靈活的查詢語句(PromQL)。
無依賴存儲,支持 local 和 remote 不同模型。
採用 http 協議,使用 pull 模式,拉取數據,簡單易懂。
監控目標,可以採用服務發現或靜態配置的方式。
支持多種統計數據模型,圖形化友好。
核心組建:
Prometheus Server, 主要用於抓取數據和存儲時序數據,另外還提供查詢和 Alert Rule 配置管理。
client libraries,用於對接 Prometheus Server, 可以查詢和上報數據。
push gateway ,用於批量,短期的監控數據的彙總節點,主要用於業務數據彙報等。
exporters ,部署在客戶端的agent 例如彙報機器數據的 node_exporter, 彙報 MongoDB 信息的 MongoDB exporter 等等。
alertmanager 用於告警通知管理的
基礎架構圖:
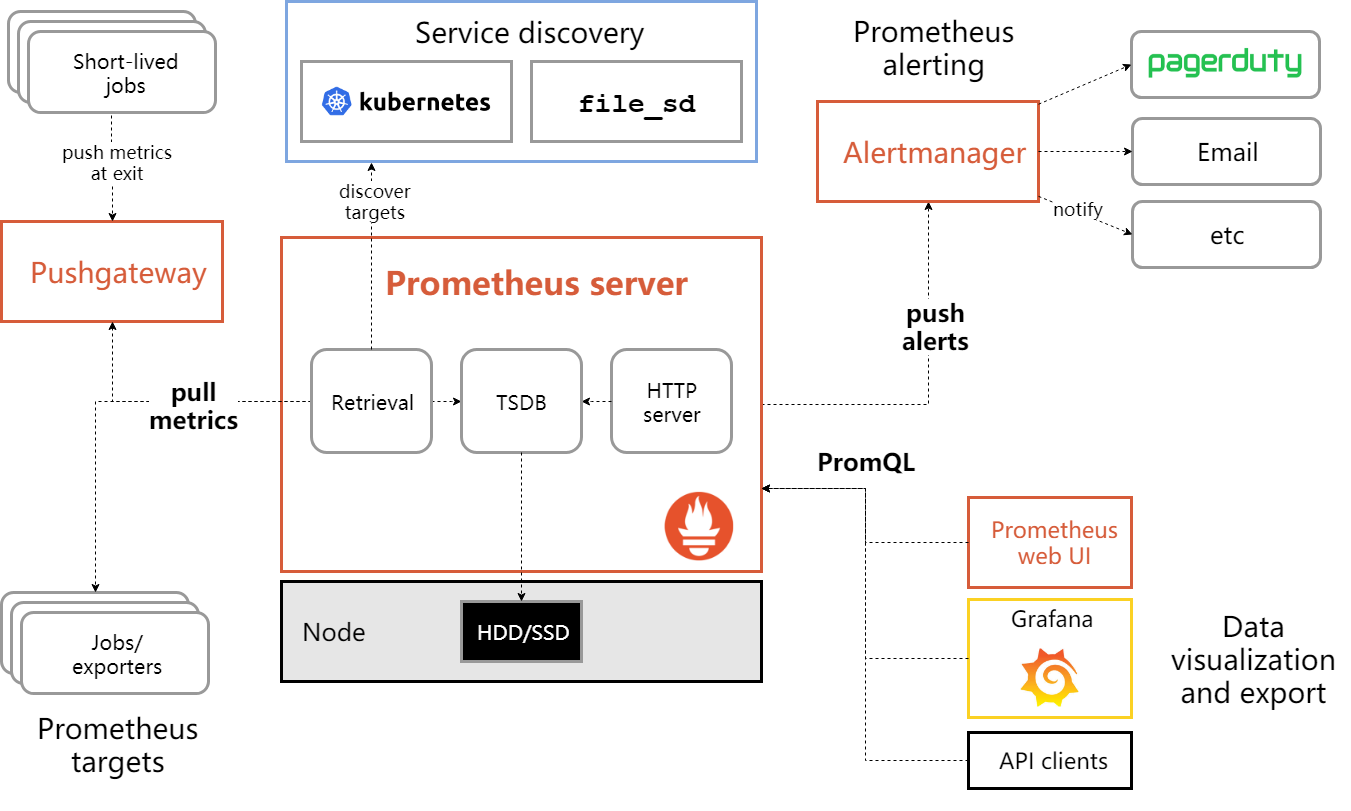
從這個架構圖,也可以看出 Prometheus 的主要模塊包含, Server, Exporters, Pushgateway, PromQL, Alertmanager, WebUI 等。
它大致使用邏輯是這樣:
Prometheus server 定期從靜態配置的 targets 或者服務發現的 targets 拉取數據。
當新拉取的數據大於配置內存緩存區的時候,Prometheus 會將數據持久化到磁盤(如果使用 remote storage 將持久化到雲端)。
Prometheus 可以配置 rules,然後定時查詢數據,當條件觸發的時候,會將 alert 推送到配置的 Alertmanager。
Alertmanager 收到警告的時候,可以根據配置,聚合,去重,降噪,最後發送警告。
可以使用 API, Prometheus Console 或者 Grafana 查詢和聚合數據。
以上內容轉載:https://songjiayang.gitbooks.io/prometheus/content/introduction/what.html
安裝:prometheus
(1)下載安裝包https://prometheus.io/download/ 至指定目錄如/Download
shell>gwet https://github.com/prometheus/prometheus/releases/download/v2.13.1/prometheus-2.13.1.darwin-amd64.tar.gz
(2)解壓prometheus
shell>tar -xvzf ~/Download/prometheus-2.13.1.linux-amd64.tar.gz
shell>mv prometheus-2.13.1.linux-amd64 prometheus
shell>cd prometheus
shell>ls prometheus
prometheus 啓動文件
prometheus.yml 配置文件
data 存儲文件
(3)檢查prometheus版本
shell> ./prometheus version
prometheus, version 2.13.0 (branch: HEAD, revision: 6ea4252299f542669aca11860abc2192bdc7bede)
  build user:       root@f30bdad2c3fd
  build date:       20191004-11:25:34
  go version:       go1.13.1
(4)啓動prometheus server
shell> ./prometheus #正常啓動會輸出很多信息
level=info ts=2019-10-17T09:29:45.851Z caller=main.go:332 msg="Starting Prometheus" version="(version=2.13.0, branch=HEAD, revision=6ea4252299f542669aca11860abc2192bdc7bede)"(5)查看端口監聽,監聽端口9090
shell>netstat -tunlp | grep prometheus
tcp6 0 0 :::9090 :::* LISTEN 31879/./prometheus
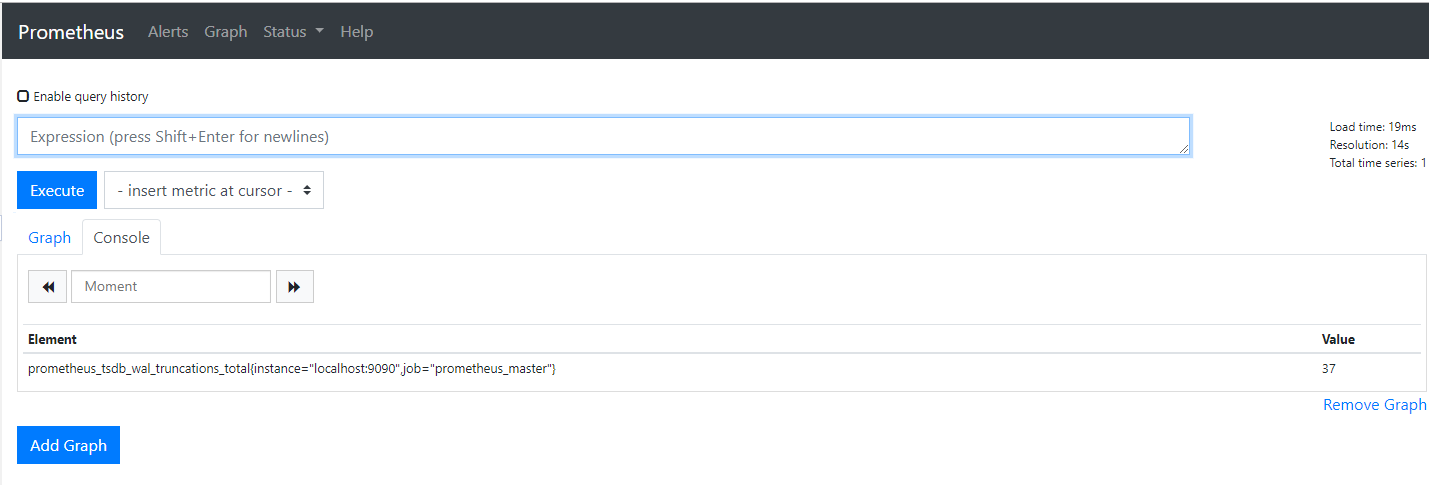
(6)通過web訪問http://IP:9090
(7)以服務的方式啓動
shell>vim /etc/systemd/system/prometheus.service
[Unit]
Description=Prometheus Monitoring System
Documentation=Prometheus Monitoring System

[Service]
ExecStart=/Download/prometheus/prometheus \
  --config.file /Download/prometheus/prometheus.yml \
  --web.listen-address=:9090

[Install]
WantedBy=multi-user.target
shell> systemctl daemon-reload
shell> systemctl enable prometheus
shell> systemctl start prometheus