


注:本博文只用於實現簡單羣集配置,更深入的資料可以參考官方文檔
Elasticsearch官方文檔
kibana官方文檔
一、準備工作
環境如下
| 系統 | IP | 服務 |
|---|---|---|
| Centos7.3 | 192.168.171.131 | ES1、logstash、ES-Head、logstash、kibana |
| Centos7.3 | 192.168.171.134 | ES2 |
| Centos7.3 | 192.168.171.135 | ES3 |
1、配置域名解析
[root@node1 ~]# cat > /etc/hosts << EOF
> 192.168.171.131  node1
> 192.168.171.134  node2
> 192.168.171.135  node3
> EOF
[root@node1 ~]# scp /etc/hosts [email protected]:/etc/hosts
[root@node1 ~]# scp /etc/hosts [email protected]:/etc/hosts
2、配置java環境
注:以下操作需要在所有節點上進行配置
JDK官方下載,由於登錄纔可以下載,所以這裏沒有使用wget
#卸載自帶的java環境
[root@node1 ~]# rpm -qa | grep jdk
copy-jdk-configs-1.2-1.el7.noarch
java-1.8.0-openjdk-headless-1.8.0.102-4.b14.el7.x86_64
java-1.8.0-openjdk-1.8.0.102-4.b14.el7.x86_64
java-1.7.0-openjdk-1.7.0.111-2.6.7.8.el7.x86_64
java-1.7.0-openjdk-headless-1.7.0.111-2.6.7.8.el7.x86_64
[root@node1 ~]# rpm -e --nodeps java-1.8.0-openjdk-headless-1.8.0.102-4.b14.el7.x86_64
[root@node1 ~]# rpm -e --nodeps java-1.7.0-openjdk-headless-1.7.0.111-2.6.7.8.el7.x86_64
#配置jdk環境
[root@node1 ~]# tar zxf jdk-8u211-linux-x64.tar.gz -C /usr/local/
[root@node1 ~]# vim /etc/profile
..........
export  JAVA_HOME=/usr/local/jdk1.8.0_211
export  JRE_HOME=/usr/local/jdk1.8.0_211/jre
export  CLASSPATH=$JAVA_HOME/lib/tools.jar:$JAVA_HOME/lib/dt.jar
export  PATH=$JAVA_HOME/bin:$JRE_HOME/bin:$PATH
#刷新配置並查看配置是否正確
[root@node1 ~]# . /etc/profile
[root@node1 ~]# java -version
java version "1.8.0_211"
Java(TM) SE Runtime Environment (build 1.8.0_211-b12)
Java HotSpot(TM) 64-Bit Server VM (build 25.211-b12, mixed mode)
二、配置ELK羣集
1、下載並安裝es的rpm安裝包
注:下載安裝的操作需要再所有節點上執行
可在es中文社區下載
[root@node1 ~]# wget https://artifacts.elastic.co/downloads/elasticsearch/elasticsearch-7.5.1-x86_64.rpm
[root@node1 ~]# rpm -ivh elasticsearch-7.5.1-x86_64.rpm
[root@node1 ~]# systemctl daemon-reload
[root@node1 ~]# systemctl enable elasticsearch.service
2、優化es(可跳過)
1)修改其默認使用內存大小
#查看elasticsearch的配置文件目錄
[root@node1 elasticsearch]# pwd
/etc/elasticsearch
[root@node1 elasticsearch]# ls
elasticsearch.keystore  jvm.options        role_mapping.yml  users
elasticsearch.yml       log4j2.properties  roles.yml         users_roles
#elasticsearch默認內存使用爲1G,可以更改如下配置,修改其默認使用內存
[root@node1 elasticsearch]# cat jvm.options
-Xms1g
-Xmx1g
注:生產環境中建議將Xms和Xmx兩個值設置爲一致,一般設置爲物理內存的一半,但最高最好不要超過30G
2)修改其打開文件數的大小
如果服務器文件數上線和線程上線較低,就會產生如下異常:
1. max file descriptors [4096] for elasticsearch process is too low, increase to at least [65536]每個進程最大同時打開文件數太小

2. max number of threads [3818] for user [es] is too low, increase to at least [4096]最大線程個數太低
可以進行以下修改,以便修改可打開文件數的大小
[root@node1 elasticsearch]# vim /etc/security/limits.conf
*               soft    nofile          65536
*               hard    nofile          65536
*               soft    nproc           4096
*               hard    nproc           4096

#注:修改上述配置後,需要退出當前用戶再重新登錄纔可生效
#重新登錄後,可以使用以下命令查看是否生效
#查看最大線程個數
[root@node1 elasticsearch]# ulimit -Hu
4096
[root@node1 elasticsearch]# ulimit -Su
4096
#查看每個進程最大同時打開文件數
[root@node1 elasticsearch]# ulimit -Sn
65536
[root@node1 elasticsearch]# ulimit -Hn
65536
3、配置es集羣
1)node1配置如下
[root@node1 ~]# vim /etc/elasticsearch/elasticsearch.yml
cluster.name: my-es       #羣集名稱
node.name: node1        #es節點名稱
bootstrap.memory_lock: false      #啓動時不鎖定內存
network.host: 0.0.0.0           #監聽地址
http.port: 9200                 #監聽端口
discovery.seed_hosts: ["node1", "node2", "node3"]    #這裏指定參與集羣的主機節點
cluster.initial_master_nodes: ["node1", "node2", "node3"]     #同上
#在配置文件末尾添加以下內容,後面es-head連接es羣集時需要
http.cors.enabled: true                #添加該行,開啓跨域訪問支持
http.cors.allow-origin: "*"            #添加該行,跨域訪問允許的域名地址
#啓動服務,並將修改好的配置文件發送到其他節點
[root@node1 ~]# systemctl start elasticsearch
[root@node1 ~]# scp /etc/elasticsearch/elasticsearch.yml [email protected]:/etc/elasticsearch/elasticsearch.yml
[root@node1 ~]# scp /etc/elasticsearch/elasticsearch.yml [email protected]:/etc/elasticsearch/elasticsearch.yml
2)配置其他節點
[root@node2 ~]# sed -i 's#node.name: node1#node.name: node2#g' /etc/elasticsearch/elasticsearch.yml
[root@node2 ~]# systemctl start elasticsearch
#node03節點配置如下
[root@node3 ~]# sed -i 's#node.name: node1#node.name: node3#g' /etc/elasticsearch/elasticsearch.yml
[root@node3 ~]# systemctl start elasticsearch
3)查看羣集是否配置成功
訪問各個節點的9200端口,即可看到如下頁面:
三個節點的UUID爲一樣的!!!
三個節點的UUID爲一樣的!!!
三個節點的UUID爲一樣的!!!
4、配置elasticsearch Head
可以使用谷歌自帶的elasticsearch head插件,在應用商店搜索如下即可安裝
也可以在linux服務器安裝ElasticSearch Head應用
這裏我們選擇在linux服務器上安裝
該插件可在github上找到
注:以下配置在其中一個節點進行即可
[root@node1 ~]# git clone git://github.com/mobz/elasticsearch-head.git
[root@node1 ~]# cd elasticsearch-head/
[root@node1 elasticsearch-head]# yum -y install epel-release
[root@node1 elasticsearch-head]# yum -y update openssl
#安裝npm(注:必須安裝epel源纔可安裝npm)
[root@node1 elasticsearch-head]# yum -y install npm
[root@node1 elasticsearch-head]# npm install
注:如果在執行npm install命令時,長時間停留在安裝界面,或者報錯,只需Ctrl+c終止後重新運行該命令即可
後臺啓動elasticsearch head,否則會一直佔用當前終端:
[root@node1 elasticsearch-head]# npm run start &
[root@node1 elasticsearch-head]# netstat -anput | grep 9100
tcp        0      0 0.0.0.0:9100            0.0.0.0:*               LISTEN      41915/grunt
瀏覽器訪問elasticsearch head所在主機的9100端口,並連接到es羣集的9200端口,即可在瀏覽器查看羣集狀態,如下:
注:Elasticsearch默認不允許第三方接入,可以修改Elasticsearch的配置文件elasticsearch.yml,添加如下所示配置(我在第一次修改配置文件時,已經增加了如下配置):
http.cors.enabled: true
http.cors.allow-origin: "*"
5、安裝kibana
1)下載並安裝kibana
[root@node1 ~]# wget https://artifacts.elastic.co/downloads/kibana/kibana-7.5.1-x86_64.rpm
[root@node1 ~]# rpm -ivh kibana-7.5.1-x86_64.rpm
2)配置kibana
[root@node1 ~]# vim /etc/kibana/kibana.yml
server.host: "0.0.0.0"
elasticsearch.hosts: ["http://192.168.171.131:9200","http://192.168.171.134:9200","http://192.168.171.135:9200"]
kibana.index: ".kibana"
[root@node1 ~]# systemctl enable kibana.service
[root@node1 ~]# systemctl start kibana
[root@node1 ~]# ss -anput | grep 5601
tcp    LISTEN     0      128       *:5601                  *:*                   users:(("node",pid=42355,fd=18))
2)漢化kibana(可選)
由於kibana 7之前的版本,官方並沒有支持中文,需要另外下載補丁包
kibana 7的版本,官方加入了中文的選項,只需要修改kibana的配置文件即可,如下:
[root@node1 ~]# sed -i 's/#i18n.locale: "en"/i18n.locale: "zh-CN"/g' /etc/kibana/kibana.yml
[root@node1 ~]# systemctl restart kibana
注:修改配置文件後,記得重啓生效
注:修改配置文件後,記得重啓生效
注:修改配置文件後,記得重啓生效
啓動完成後,訪問主機的5601端口,即可看到如下界面:
6、安裝logstash收集日誌
在實際生產環境中,大多中小架構可能是這樣的:filebeat>>kafka>>logstash>>elasticsearch>>kibana,我這裏只是想將新版的某些組件安裝配置一下,所以省略了前兩個,直接用logstash來收集主機日誌了。
注:下面收集的有nginx的日誌,請自行配置nginx。
#下載logstash並安裝
[root@node1 ~]# wget https://artifacts.elastic.co/downloads/logstash/logstash-7.5.1.rpm
[root@node1 ~]# rpm -ivh  logstash-7.5.1.rpm
#設置開機自啓
[root@node1 ~]# systemctl daemon-reload
[root@node1 ~]# systemctl enable logstash.service
#編輯配置文件,收集日誌
[root@node1 ~]# cd /etc/logstash/conf.d/
[root@node1 conf.d]# vim nginx_log.conf
input {
    file{
      path => "/var/log/messages"
      type => "system"
      start_position => "beginning"
        }
    file{
       path => "/var/log/nginx/access.log"
       type => "access"
       start_position => "beginning"
        }
    file{
       path => "/var/log/nginx/error.log"
       type => "error"
       start_position => "beginning"
        }
    }

output {
    if [type] == "system" {
        elasticsearch {
            hosts => ["192.168.171.131:9200"]
            index => "system-%{+YYYY.MM.dd}"
            }
            }
    if [type] == "access" {
        elasticsearch {
            hosts => ["192.168.171.131:9200"]
            index => "access-%{+YYYY.MM.dd}"
            }
            }

    if [type] == "error" {
        elasticsearch {
            hosts => ["192.168.171.131:9200"]
            index => "error-%{+YYYY.MM.dd}"
            }
            }
}
[root@node1 conf.d]# chmod +r /var/log/messages             #賦予該目錄其他人的讀權限
[root@node1 conf.d]# ln -sf /usr/share/logstash/bin/logstash  /usr/local/bin/                  #對命令做軟連接
[root@node1 conf.d]# systemctl start logstash
[root@node1 conf.d]# logstash -f nginx_log.conf &             #放入後臺運行
7、登錄es查看是否創建索引
顯示如下,表示正常:
8、進入kibana添加索引

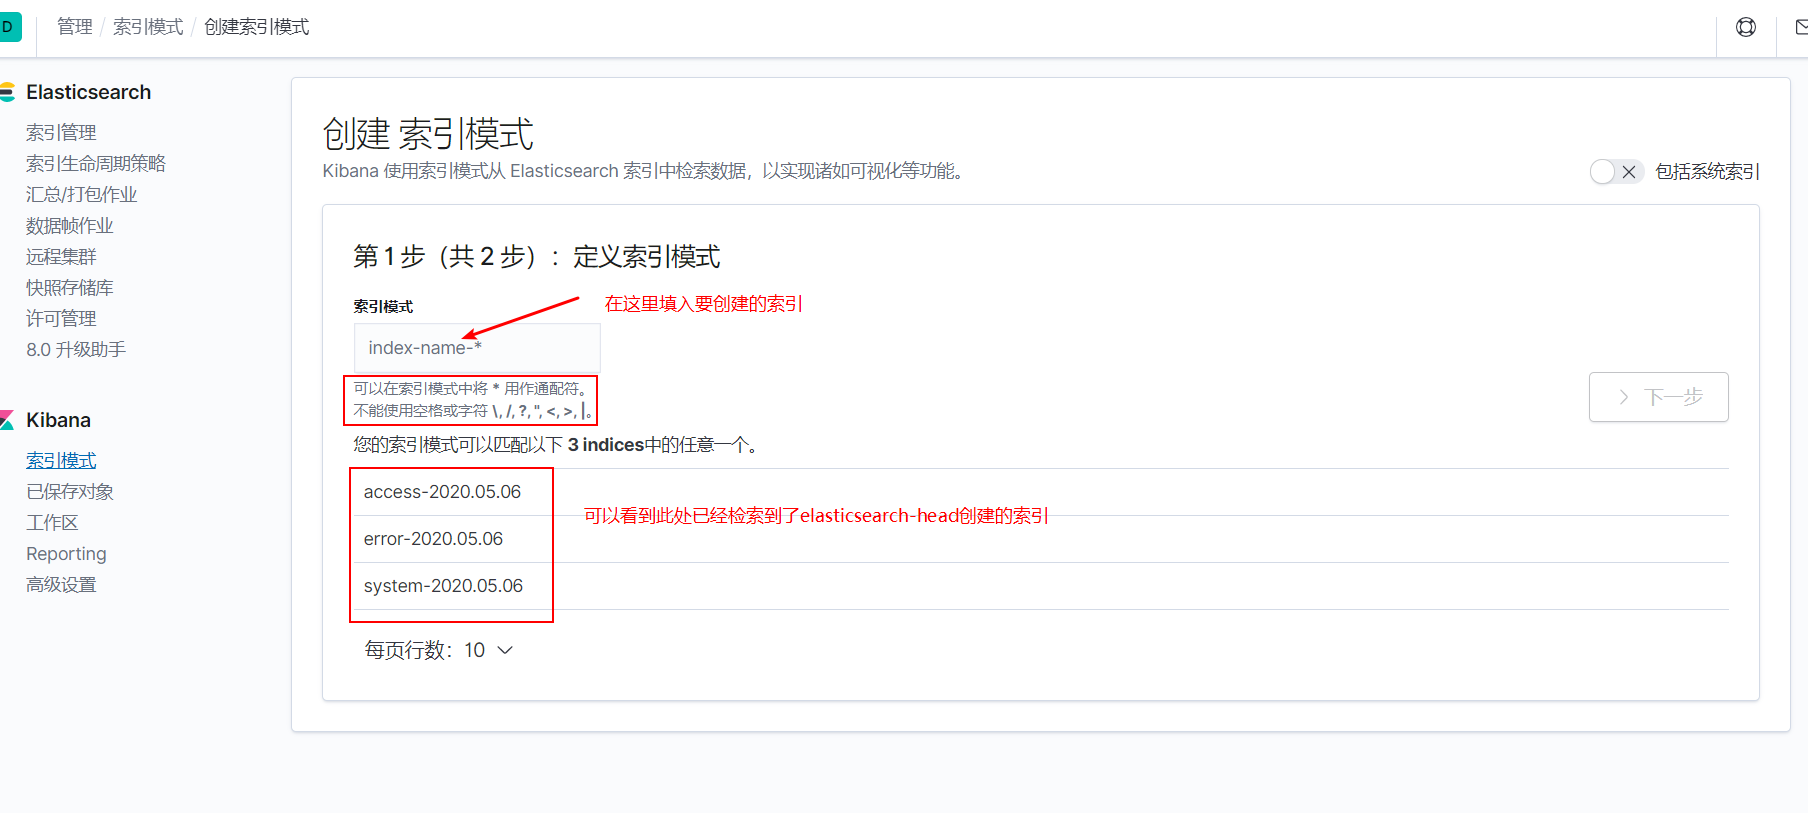

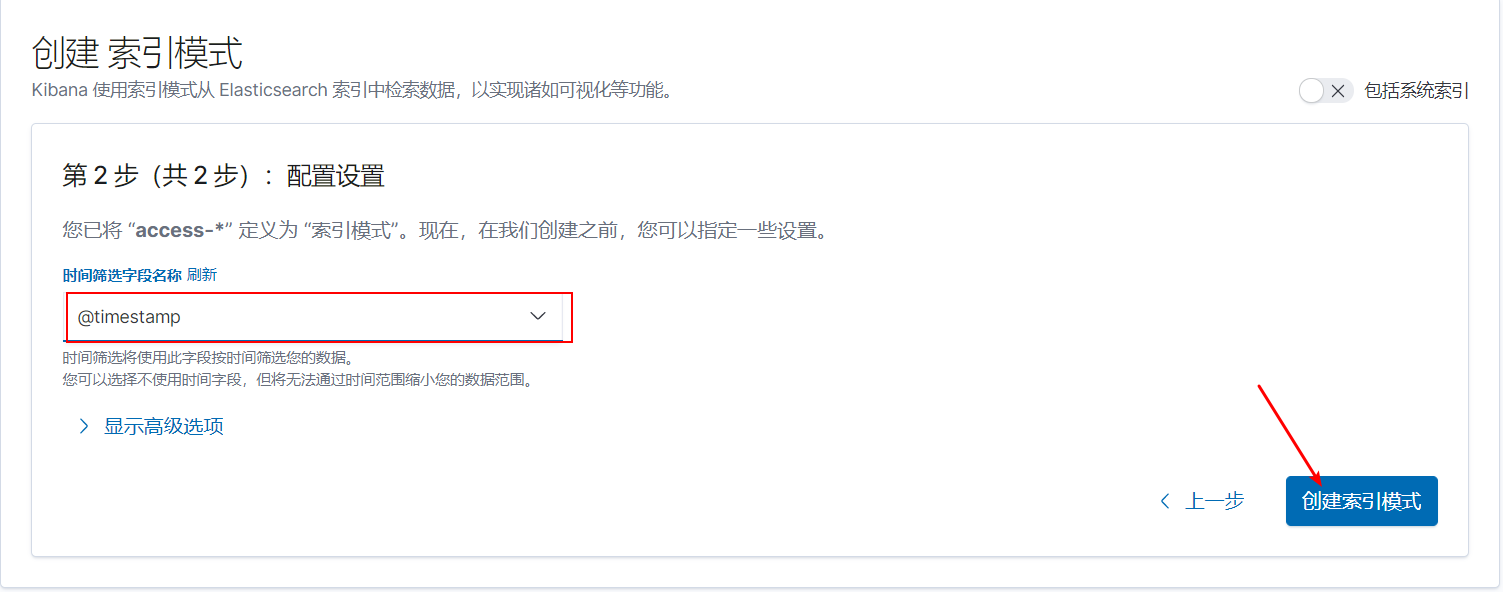
接下來再添加一個error的索引,我比較懶,就不添加了哈