


前言
ceph的可視化方案很多,本篇介紹的是比較簡單的一種方式,並且對包都進行了二次封裝,所以能夠在極短的時間內構建出一個可視化的監控系統
本系統組件如下:
- ceph-jewel版本
- ceph_exporter的jewel版本
- prometheus的2.3.2版本
- grafana的grafana-5.2.1版本
- Ceph grafana的插件- Clusterby Cristian Calin
適配的系統爲centos7
資源如下:
http://static.zybuluo.com/zphj1987/jiwx305b8q1hwc5uulo0z7ft/ceph_exporter-2.0.0-1.x86_64.rpm
http://static.zybuluo.com/zphj1987/1nu2k4cpcery94q2re3u6s1t/ceph-cluster_rev1.json
http://static.zybuluo.com/zphj1987/7ro7up6r03kx52rkwy1qjuwm/prometheus-2.3.2-1.x86_64.rpm
http://7xweck.com1.z0.glb.clouddn.com/grafana-5.2.1-1.x86_64.rpm
以上資源均可以直接用wget進行下載,然後直接安裝
監控的架構介紹
通過ceph_exporter抓取的ceph相關的數據並且在本地監聽端口9128端口
prometheus抓取ceph_exporter的9128的端口的數據存儲在本地的/var/lib/prometheus/目錄下面
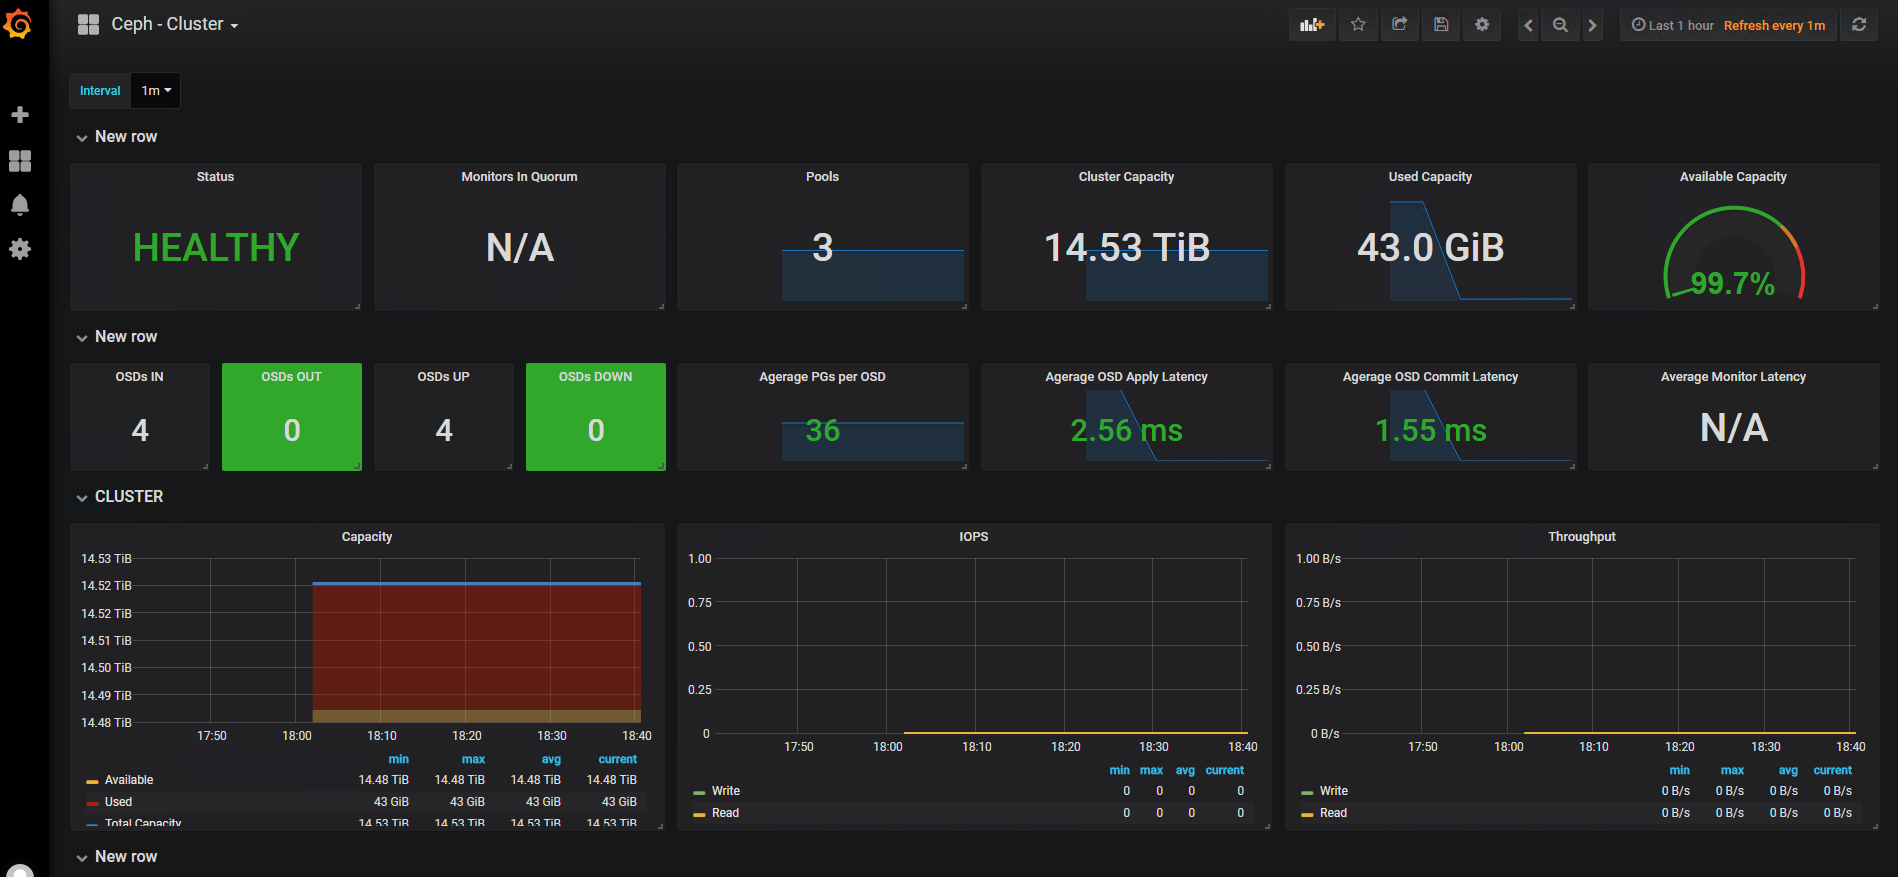
grafana抓取prometheus的數據進行渲染成web頁面
頁面的模板就是使用的grafana的ceph模板插件
那麼我們就根據上面的架構去一步步的把系統配置起來
配置監控系統
安裝ceph_exporter
[root@lab101 install]# wget http://static.zybuluo.com/zphj1987/jiwx305b8q1hwc5uulo0z7ft/ceph_exporter-2.0.0-1.x86_64.rpm [root@lab101 install]# rpm -qpl ceph_exporter-2.0.0-1.x86_64.rpm /usr/bin/ceph_exporter /usr/lib/systemd/system/ceph_exporter.service [root@lab101 install]# rpm -ivh ceph_exporter-2.0.0-1.x86_64.rpm Preparing... ################################# [100%] Updating / installing... 1:ceph_exporter-2:2.0.0-1 ################################# [100%] [root@lab101 install]# systemctl start ceph_exporter [root@lab101 install]# systemctl enable ceph_exporter [root@lab101 install]# netstat -tunlp|grep 9128 tcp6 0 0 :::9128 :::* LISTEN 35853/ceph_exporter |
可以看到端口起來了就是安裝成功了,這個ceph_exporter建議是安裝在管理節點上,也就是能夠執行出ceph -s的節點上面的
安裝prometheus
[root@lab101 install]# wget http://static.zybuluo.com/zphj1987/7ro7up6r03kx52rkwy1qjuwm/prometheus-2.3.2-1.x86_64.rpm [root@lab101 install]# rpm -qpl prometheus-2.3.2-1.x86_64.rpm /etc/ceph/prometheus.yml /usr/bin/prometheus /usr/lib/systemd/system/prometheus.service [root@lab101 install]# rpm -ivh prometheus-2.3.2-1.x86_64.rpm Preparing... ################################# [100%] Updating / installing... 1:prometheus-2:2.3.2-1 ################################# [100%] [root@lab101 install]# systemctl start prometheus [root@lab101 install]# netstat -tunlp|grep 9090 tcp6 0 0 :::9090 :::* LISTEN 36163/prometheus |
這個地方默認是認爲prometheus和ceph_exporter在一臺機器上面,所以配置文件的/etc/ceph/prometheus.yml裏面的targets寫的是127.0.0.1,根據需要修改成ceph_exporter的ip地址即可
prometheus的默認監聽端口爲9090,到這個時候直接去web 上面就可以看到prometheus的抓取的數據了
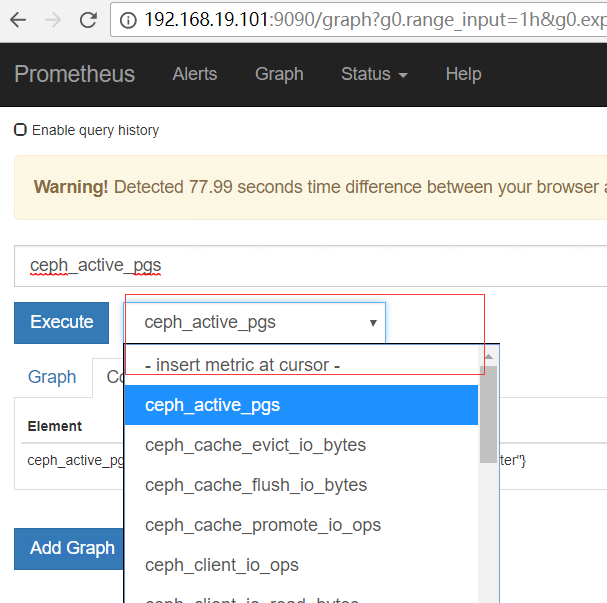
到這裏是數據到prometheus的已經完成了,下面就去做跟grafana相關的配置了
安裝grafana
[root@lab101 install]# wget http://7xweck.com1.z0.glb.clouddn.com/grafana-5.2.1-1.x86_64.rpm [root@lab101 install]# yum localinstall grafana-5.2.1-1.x86_64.rpm [root@lab101 install]# systemctl start grafana-server.service [root@lab101 install]# netstat -tunlp|grep gra Proto Recv-Q Send-Q Local Address Foreign Address State PID/Program name tcp6 0 0 :::3000 :::* LISTEN 36730/grafana-serve |
grafana默認監聽的3000的端口

默認登陸的用戶名密碼爲admin admin,登陸成功後會強制修改密碼
配置grafana
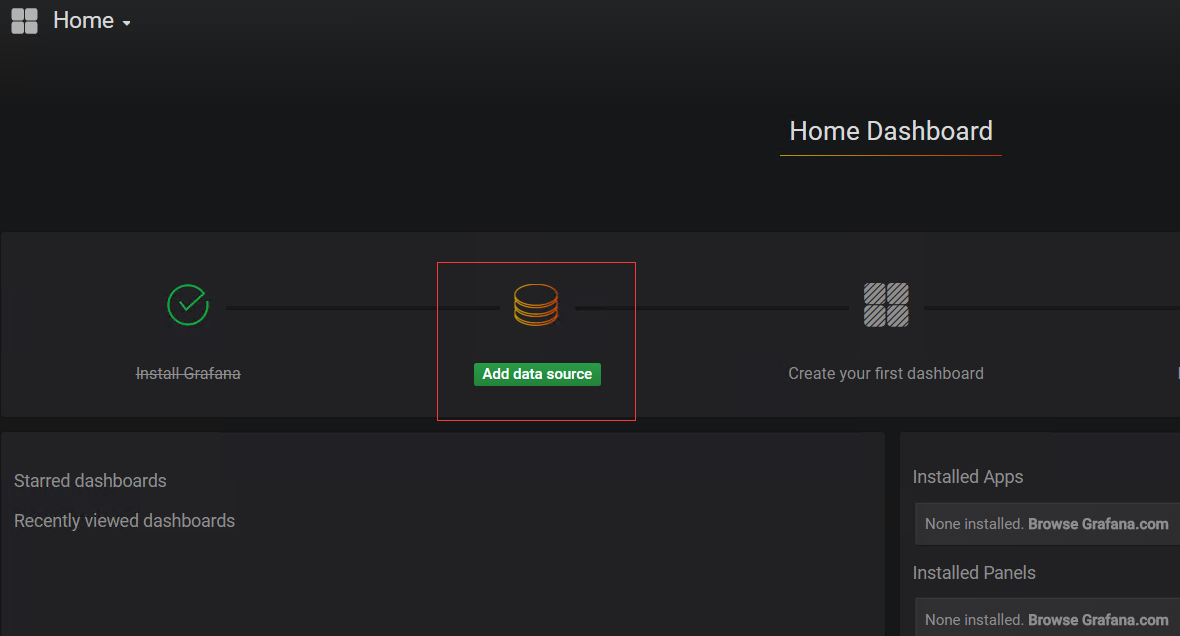
首先增加數據源


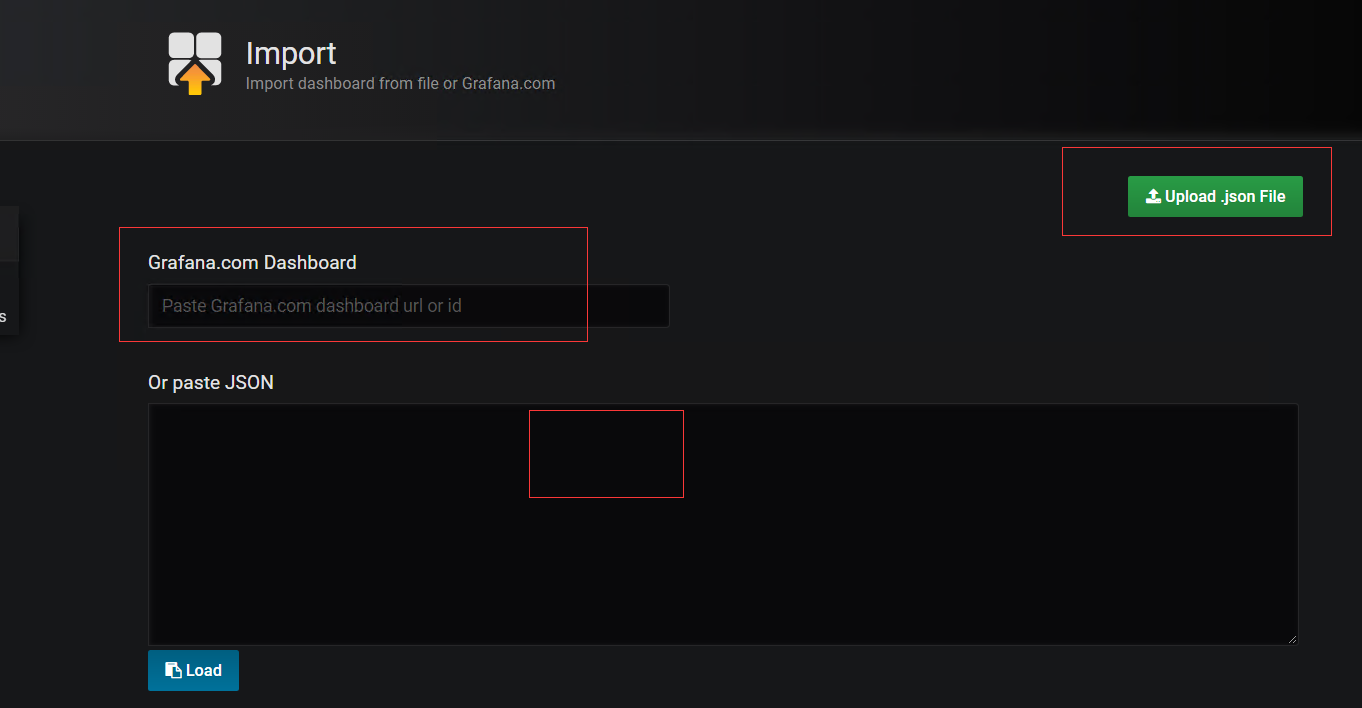

這裏如果能上網就直接輸入id 917 ,如果不能上網就把上面的ceph-cluster_rev1.json文件弄到本地去,導入進去即可
到這裏就完成了配置了
總結
以上爲了方便都把相關的軟件做成了rpm包,從安裝方便角度來看,grafana,ceph_exporter,還有prometheus都採用的是單二進制文件的方式,稍微組合一下大大的降低了部署難度,比如那個ceph_exporter需要用go進行編譯,封好包以後就不需要這個過程,並且接口因爲有版本的限制,所以這樣直接對應版本安裝也避免了出錯
本篇的環境所述均爲jewel適配版本