


文檔參考:https://www.cnblogs.com/yuhuLin/p/7018858.html
一、ELK搭建篇
——————————————————————————————————————————
官網地址:https://www.elastic.co/cn/
官網權威指南:https://www.elastic.co/guide/cn/elasticsearch/guide/current/index.html
安裝指南:https://www.elastic.co/guide/en/elasticsearch/reference/5.x/rpm.html
ELK是Elasticsearch、Logstash、Kibana的簡稱,這三者是核心套件,但並非全部。
Elasticsearch是實時全文搜索和分析引擎,提供蒐集、分析、存儲數據三大功能;是一套開放REST和JAVA API等結構提供高效搜索功能,可擴展的分佈式系統。它構建於Apache Lucene搜索引擎庫之上。
Logstash是一個用來蒐集、分析、過濾日誌的工具。它支持幾乎任何類型的日誌,包括系統日誌、錯誤日誌和自定義應用程序日誌。它可以從許多來源接收日誌,這些來源包括 syslog、消息傳遞(例如 RabbitMQ)和JMX,它能夠以多種方式輸出數據,包括電子郵件、websockets和Elasticsearch。
Kibana是一個基於Web的圖形界面,用於搜索、分析和可視化存儲在 Elasticsearch指標中的日誌數據。它利用Elasticsearch的REST接口來檢索數據,不僅允許用戶創建他們自己的數據的定製儀表板視圖,還允許他們以特殊的方式查詢和過濾數據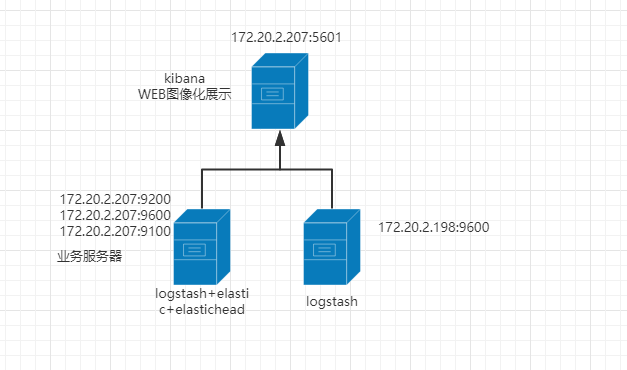
環境
——————————————————————————————————————————
centos7.3兩臺
IP:172.20.2.207 安裝:elasticsearch、logstash、Kibana、Nginx、Http、Redis
173.172.20.2.198 安裝:logstash
備註:此次安裝的ELK三個組件均爲最新版(6.5.1)。在安裝配置過程中出現各種各樣的問題。不過和其他版本的安裝基本一樣。這裏不再詳細描述安裝過程,將安裝服務做成腳本。便於後續自動安裝ELK。
ELK總的安裝腳本:https://github.com/LWang22/-/blob/master/install_elk.sh
elastic安裝腳本: https://github.com/LWang22/-/blob/master/install_elastic.sh
logstash安裝腳本:https://github.com/LWang22/-/blob/master/install_logstash.sh
kibana安裝腳本: https://github.com/LWang22/-/blob/master/install_kibana.sh
手動安裝參考:https://www.cnblogs.com/yuhuLin/p/7018858.html本次配置也是參考此鏈接。
此處詳細描述下elastic-head的安裝過程,之前安裝是源碼安裝,其實和rpm安裝差不多,但就是 npm install 有問題。這裏安裝npm的rpm安裝方式。
使用 git 安裝elasticsearch-head
yum -y install npm
git clone git://github.com/mobz/elasticsearch-head.git
cd elasticsearch-head
npm install (安裝模塊到node_modules;安裝的是grunt模塊)
進入grunt模塊,啓動grunt模塊。
nohup ./grunt server &
檢查端口是否起來
netstat -anple | grep 9100 
瀏覽器訪問測試是否正常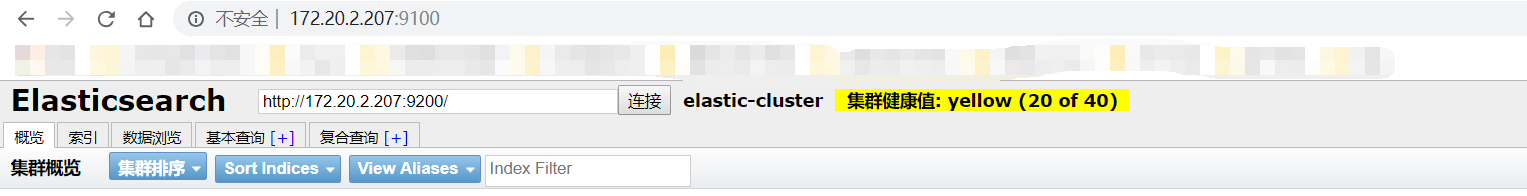
logStash的使用
——————————————————————————————————————————
執行logstash命令
./logstash -e 'input { stdin { } } output { stdout {} }'
運行成功後輸入:
你好
stdout返回的結果: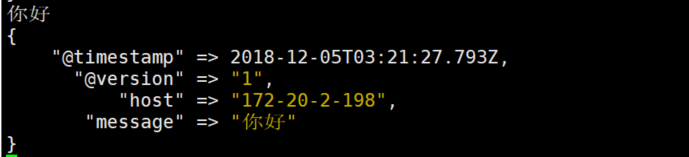
注:
-e 執行操作
input 標準輸入
{ input } 插件
output 標準輸出
{ stdout } 插件
通過rubydebug來輸出下更詳細的信息
#./logstash -e 'input { stdin { } } output { stdout {codec => rubydebug} }'
執行成功輸入:
怎麼這麼慢
stdout輸出的結果:
如果標準輸出還有elasticsearch中都需要保留應該怎麼玩,看下面
#bin/logstash -e 'input { stdin { } } output { elasticsearch { hosts => ["172.20.2.207:9200"] } stdout { codec => rubydebug }}'
運行成功以後輸入:
I am elk
返回的結果(標準輸出中的結果):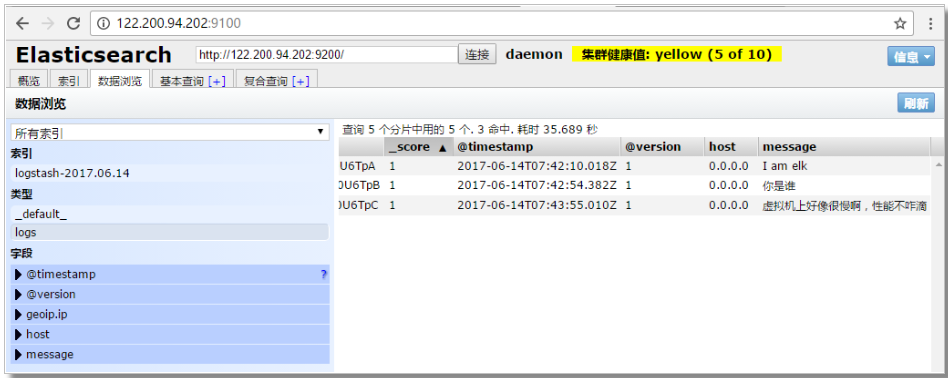
上圖引用
logstash使用配置文件
——————————————————————————————————————————
官方指南:
https://www.elastic.co/guide/en/logstash/current/configuration.html
創建配置文件elk.conf
#vim /etc/logstash/conf.d/elk.conf
文件中添加以下內容
input { stdin { } }
output {
elasticsearch { hosts => ["192.168.1.202:9200"] }
stdout { codec => rubydebug }
}
使用配置文件運行logstash
#bin/logstash -f config/elk.conf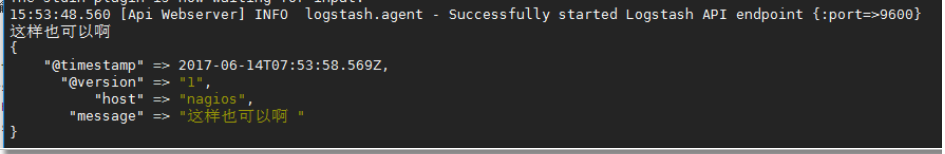
logstash的數據類型
——————————————————————————————————————————
file插件的使用
#vim /etc/logstash/conf.d/elk.conf
添加如下配置
input {
file {
path => "/var/log/messages"
type => "system"
start_position => "beginning"
}
}
output {
elasticsearch {
hosts => ["172.20.2.207:9200"]
index => "system-%{+YYYY.MM.dd}"
}
}
運行logstash指定elk.conf配置文件,進行過濾匹配
#bin/logstash -f config/elk.conf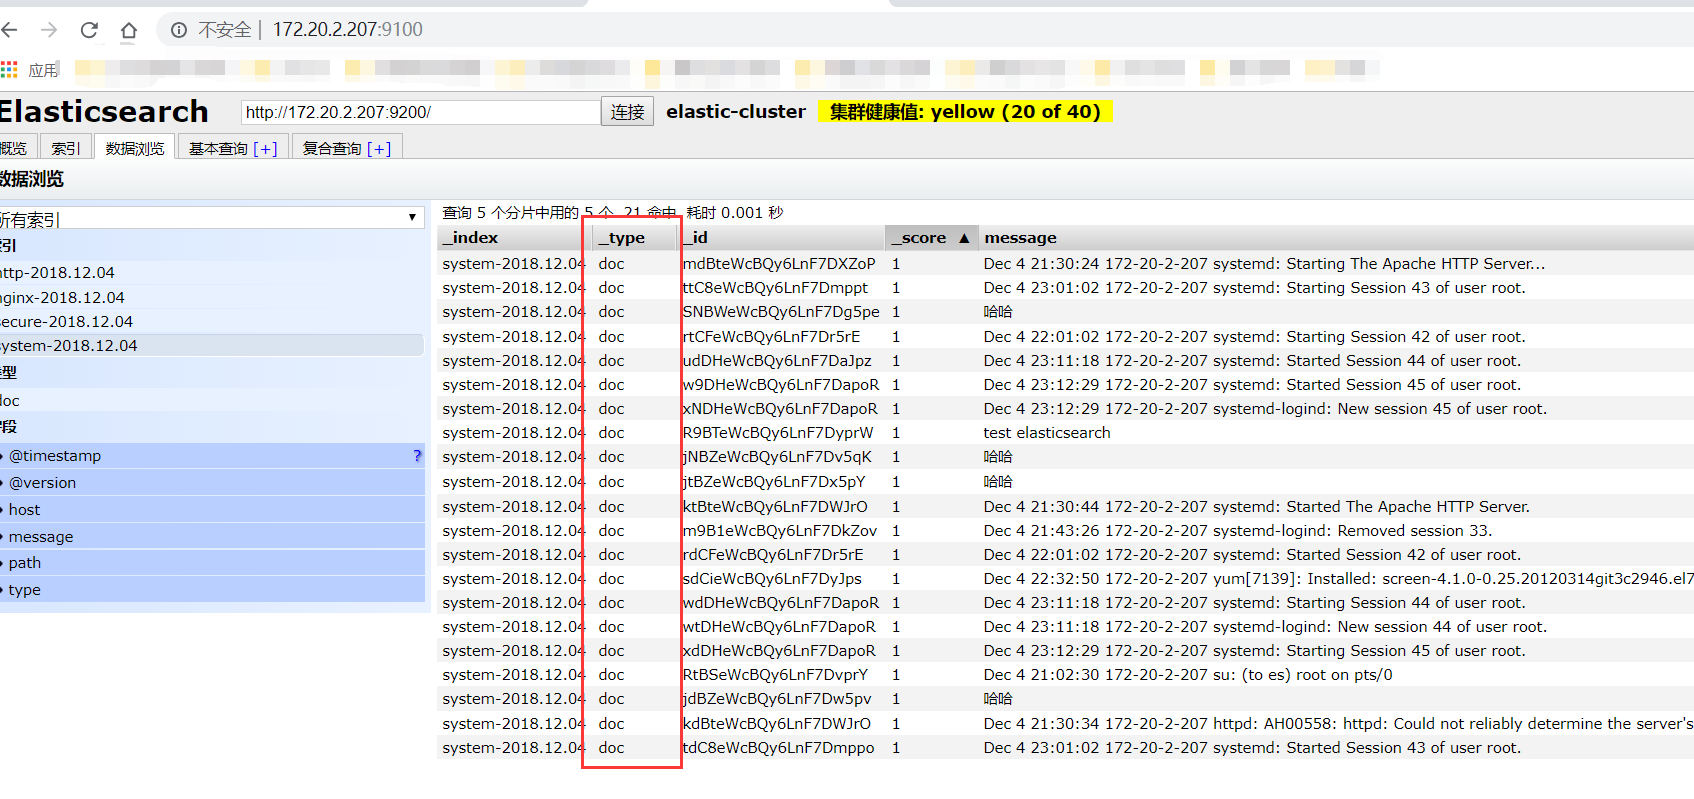
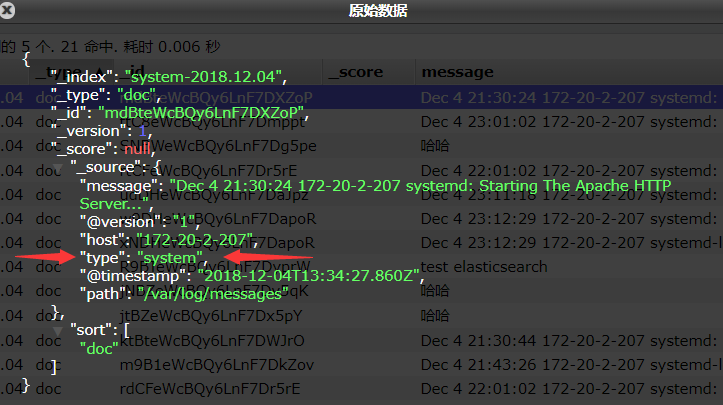
logstash上面沒有顯示出來type類型,顯示的_type。打開索引可查看具體的type。如圖所示。
來一發配置安全日誌的並且把日誌的索引按類型做存放,繼續編輯elk.conf文件
#vim /etc/logstash/conf.d/elk.conf
添加secure日誌的路徑
input {
file {
path => "/var/log/messages"
type => "system"
start_position => "beginning"
}
file {
    path => "/var/log/secure"
    type => "secure"
    start_position => "beginning"
}
}
output {
if [type] == "system" {

    elasticsearch {
        hosts => ["172.20.2.207:9200"]
        index => system-%{+YYYY.MM.dd}"
    }
}

if [type] == "secure" {

    elasticsearch {
        hosts => ["172.20.2.207:9200"]
        index => "secure-%{+YYYY.MM.dd}"
    }
}
}
運行logstash指定elk.conf配置文件,進行過濾匹配
#bin/logstash -f config/elk.conf 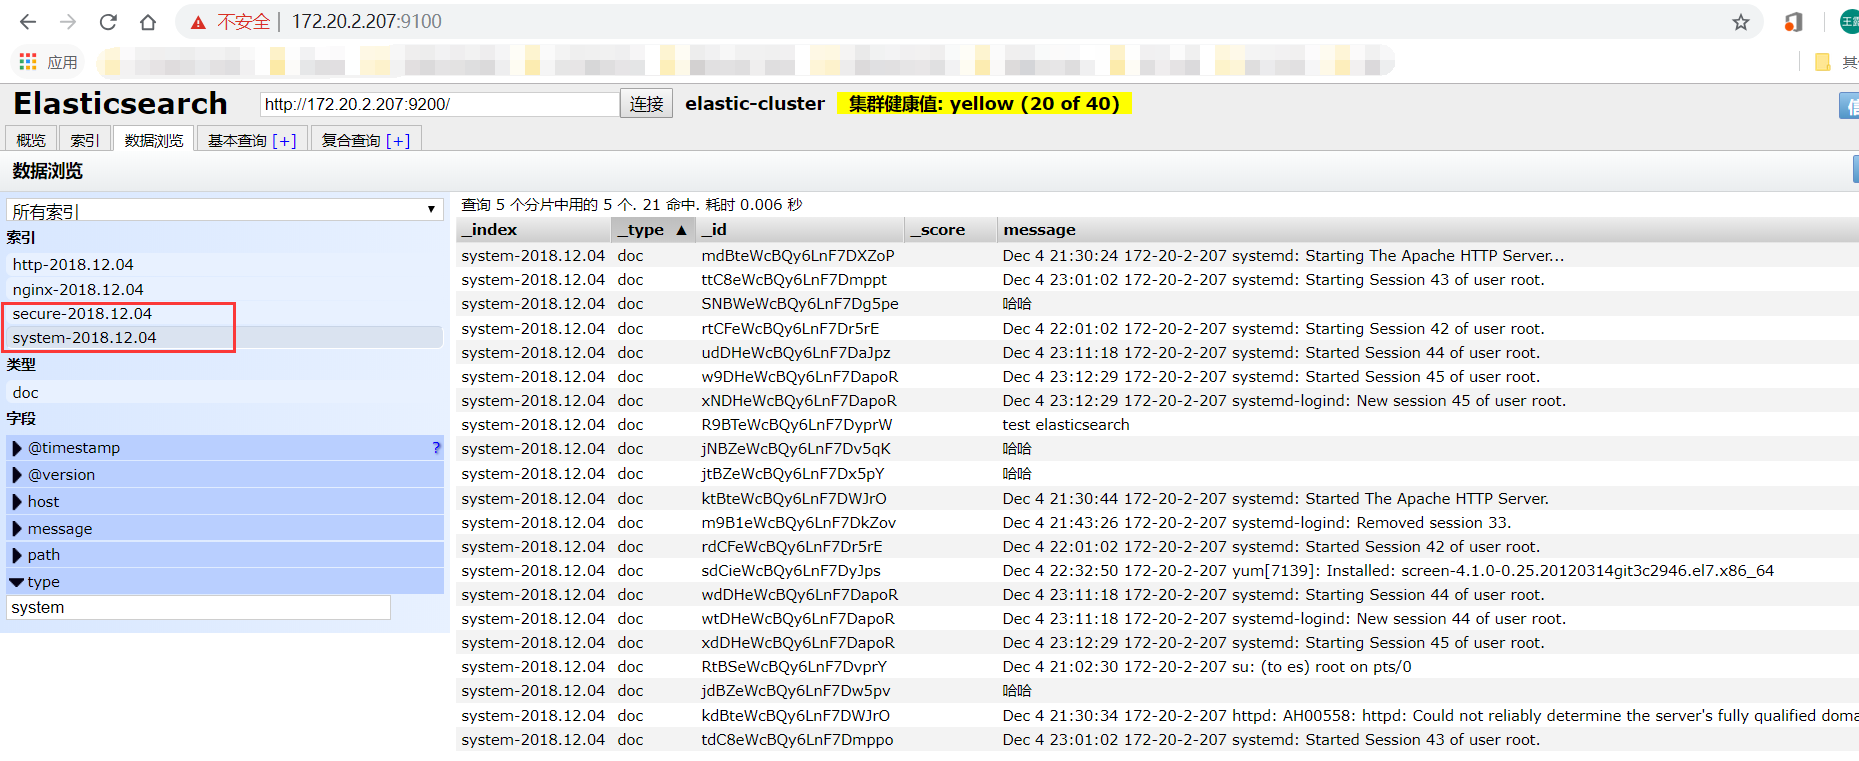
這些都沒有問題,接下來安裝kibana,可以在前臺展示。
kibana的安裝和使用
kibana的安裝較簡單,因爲目前僅僅是簡單使用,因此調整的參數不是很多。
安裝kibana環境
官方安裝手冊:https://www.elastic.co/guide/en/kibana/current/install.html
因爲上述已經安裝過kibana了,因此保證kiban.yml開啓以下配置即可。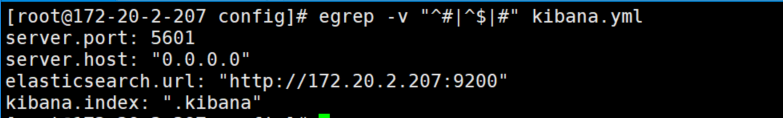
在bin目錄下執行,在後臺運行起來。nohup還是有缺陷,後面會改成supervisor
nohup ./kibana &
查看5601端口監聽情況(kibana監聽端口:5601)
在web瀏覽器訪問172.20.2.207:5601
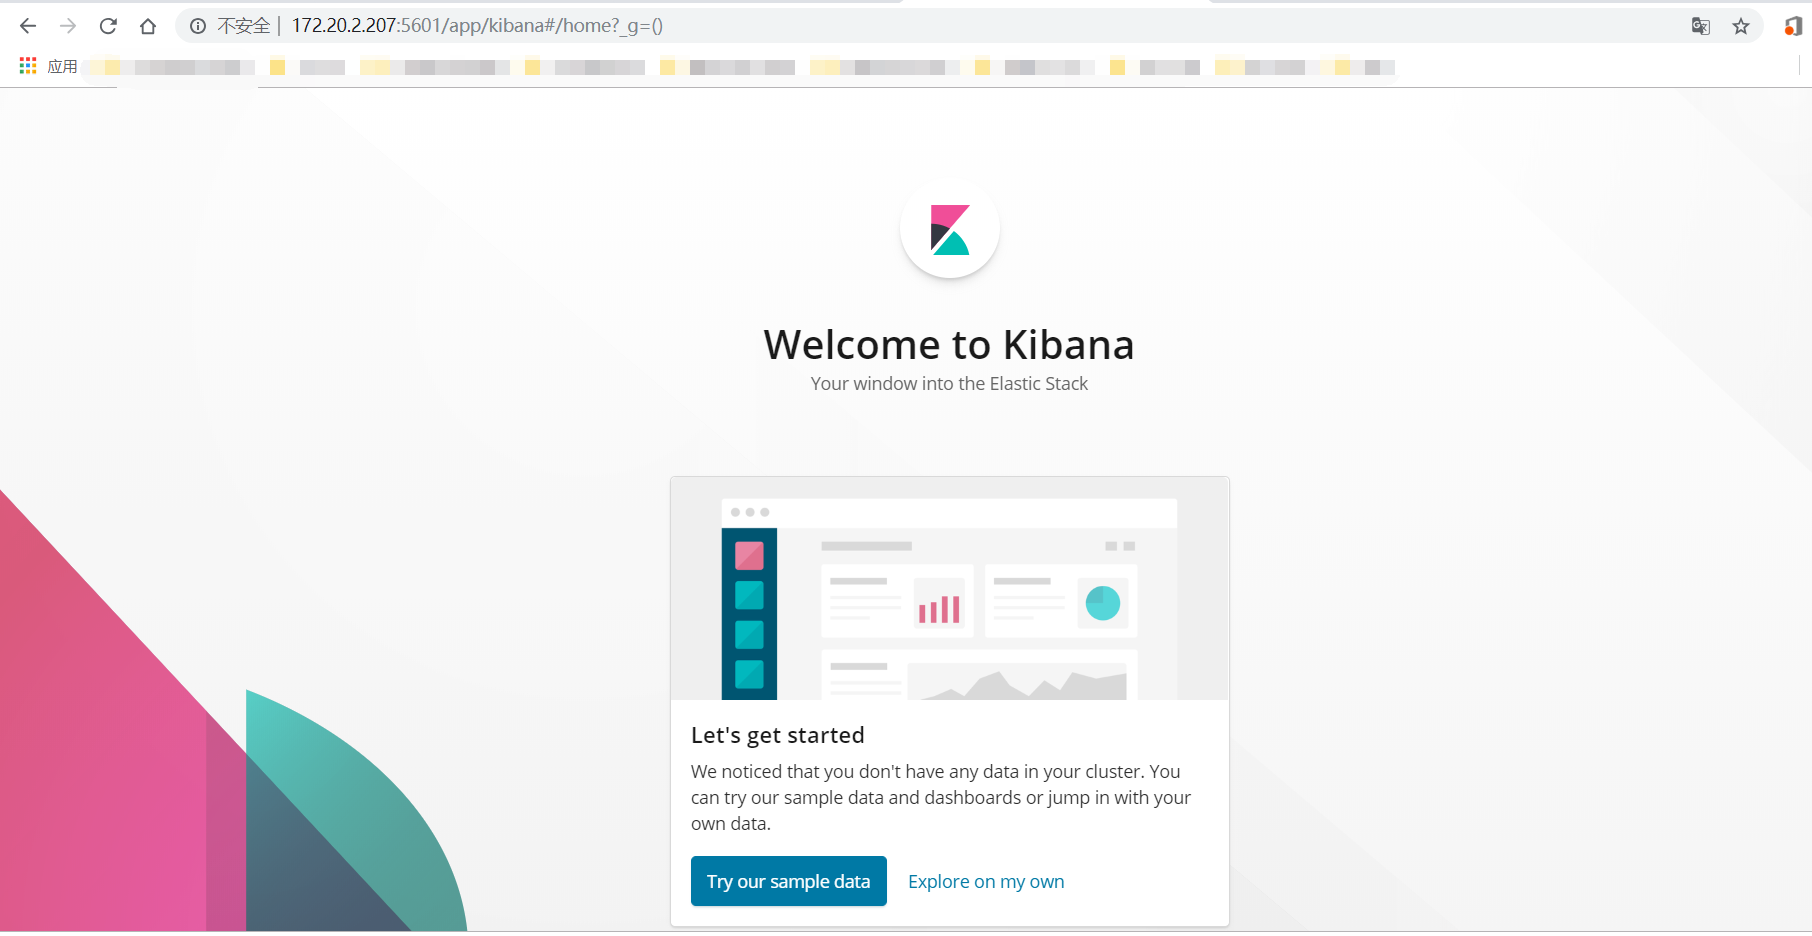
這裏我們不使用kibana提供的模板數據,探索我們的自己的數據。因此選擇 Explore on my own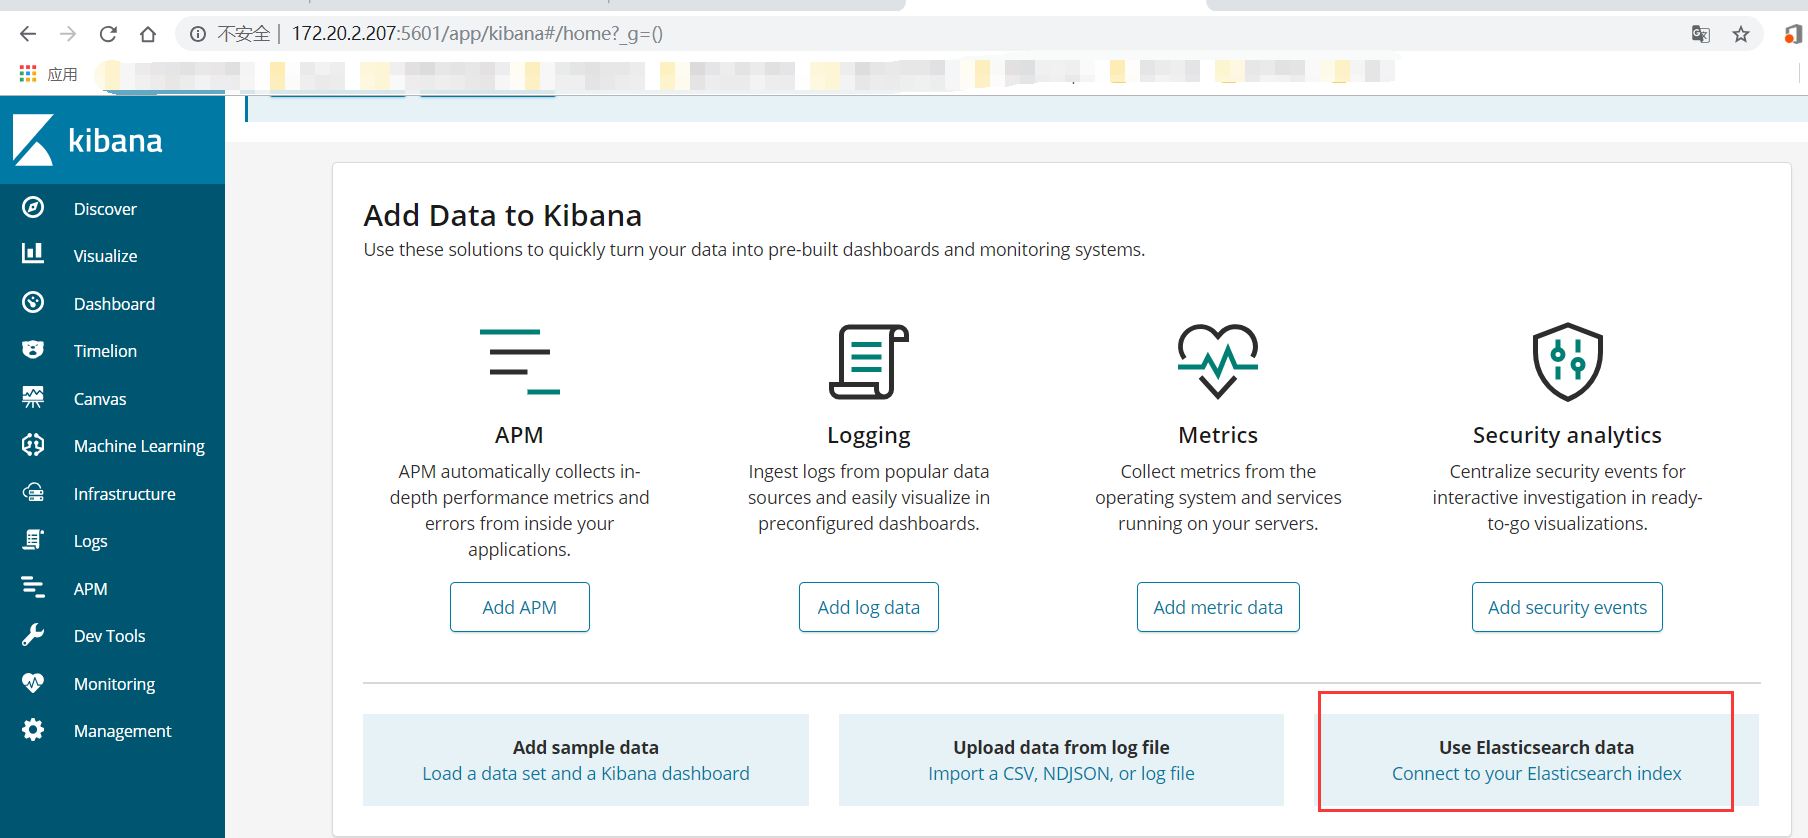
選擇 Connect to your Elasticsearch index ;創建索引(創建索引和elastic上面看到的一樣,這樣kibana就能根據elastic存儲的數據進行搜索展示了)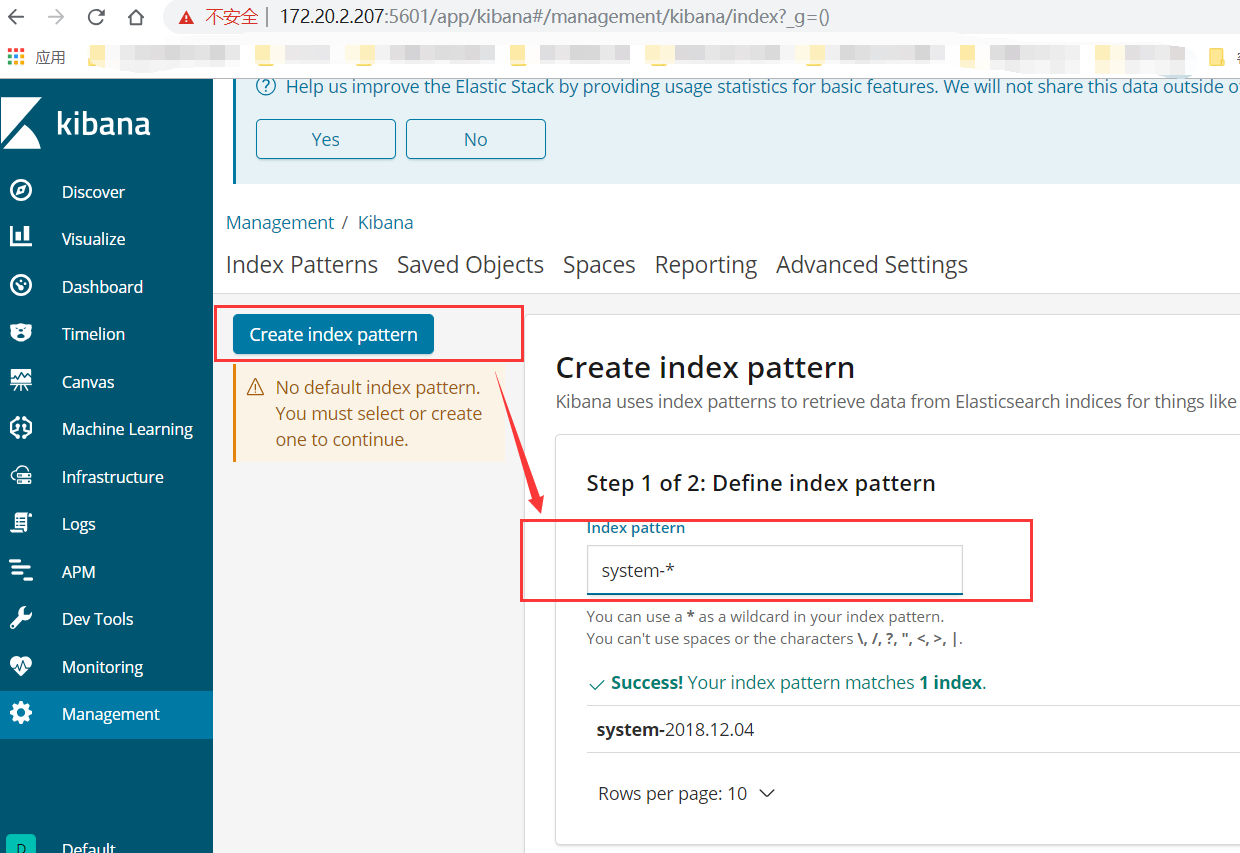
創建完索引後儘可以在Discover界面查看到elastic保存的數據了。
二、ELK實戰篇
——————————————————————————————————————————
好,現在索引也可以創建了,現在可以來輸出nginx、apache、message、secrue的日誌到前臺展示(Nginx有的話直接修改,沒有自行安裝)
編輯nginx配置文件,修改以下內容(在http模塊下添加)
log_format json '{"@timestamp":"$time_iso8601",'
         '"@version":"1",'
         '"client":"$remote_addr",'
         '"url":"$uri",'
         '"status":"$status",'
         '"domian":"$host",'
         '"host":"$server_addr",'
         '"size":"$body_bytes_sent",'
         '"responsetime":"$request_time",'
         '"referer":"$http_referer",'
         '"ua":"$http_user_agent"'
      '}';
修改access_log的輸出格式爲剛纔定義的json
access_log logs/elk.access.log json;
繼續修改apache的配置文件
LogFormat "{ \
    \"@timestamp\": \"%{%Y-%m-%dT%H:%M:%S%z}t\", \
    \"@version\": \"1\", \
    \"tags\":[\"apache\"], \
    \"message\": \"%h %l %u %t \\\"%r\\\" %>s %b\", \
    \"clientip\": \"%a\", \
    \"duration\": %D, \
    \"status\": %>s, \
    \"request\": \"%U%q\", \
    \"urlpath\": \"%U\", \
    \"urlquery\": \"%q\", \
    \"bytes\": %B, \
    \"method\": \"%m\", \
    \"site\": \"%{Host}i\", \
    \"referer\": \"%{Referer}i\", \
    \"useragent\": \"%{User-agent}i\" \
   }" ls_apache_json
一樣修改輸出格式爲上面定義的json格式
CustomLog logs/access_log ls_apache_json
編輯logstash配置文件,進行日誌收集
vim /etc/logstash/conf.d/full.conf
input {
file {
    path => "/var/log/messages"
    type => "system"
    start_position => "beginning"
}

file {
    path => "/var/log/secure"
    type => "secure"
    start_position => "beginning"
}

file {
    path => "/etc/httpd/logs/access_log"
    type => "http"
    start_position => "beginning"
}

file {
    path => "/var/log/nginx/access.log"
    type => "nginx"
    start_position => "beginning"
}
}
output {
if [type] == "system" {

    elasticsearch {
        hosts => ["172.20.2.207:9200"]
        index => "system-%{+YYYY.MM.dd}"
    }
}

if [type] == "secure" {

    elasticsearch {
        hosts => ["172.20.2.207:9200"]
        index => "secure-%{+YYYY.MM.dd}"
    }
}

if [type] == "http" {

    elasticsearch {
        hosts => ["172.2.20.207:9200"]
        index => "http-%{+YYYY.MM.dd}"
    }
}

if [type] == "nginx" {

    elasticsearch {
        hosts => ["172.20.2.207:9200"]
        index => "nginx-%{+YYYY.MM.dd}"
    }
}
}
運行看看效果如何
bin/logstash -f config/elk.conf
其實前面已經展示了。這裏不再重複展示。