


一、簡介
Prometheus
Prometheus 是一個開源監控系統,它本身已經成爲了雲原生中指標監控的事實標準,幾乎所有 Kubernetes 的核心組件以及其它雲原生系統都以 Prometheus 的指標格式輸出自己的運行時監控信息。
主要特性:
- 使用指標名稱及鍵值對標識的多維度數據模型。
- 採用彈性查詢語言PromQL。
- 不依賴分佈式存儲,爲自治的單點服務。
- 使用http完成對監控數據的拉取。
- 通過網關支持時序數據的推送。
- 支持多種圖形和Dashboard的展示。
另外在Prometheus的整個生態系統中有各種可選組件,用於功能的擴充。
Prometheus-Operator
CoreOS提供了一種名爲Operator的管理工具,他是管理特定應用程序的控制器。通過擴展Kubernetes API以軟件的方式幫助用戶創建、配置和管理複雜的或又狀態的應用程序實例(如etcd、Redis、MySQL、Prometheus等)。
它通過Kubernetes的CRD(Custom Resource Definition,自定義資源定義)對Prometheus和Prometheus需要監控的服務進行部署和配置。
Prometheus-Operator使用下面兩種資源來配置Prometheus及其要監控的服務。
- Prometheus:爲Prometheus的deployment。
- ServiceMonitor:用於描述Prometheus監控的服務。
首先我們先來了解下 Prometheus-Operator 的架構圖: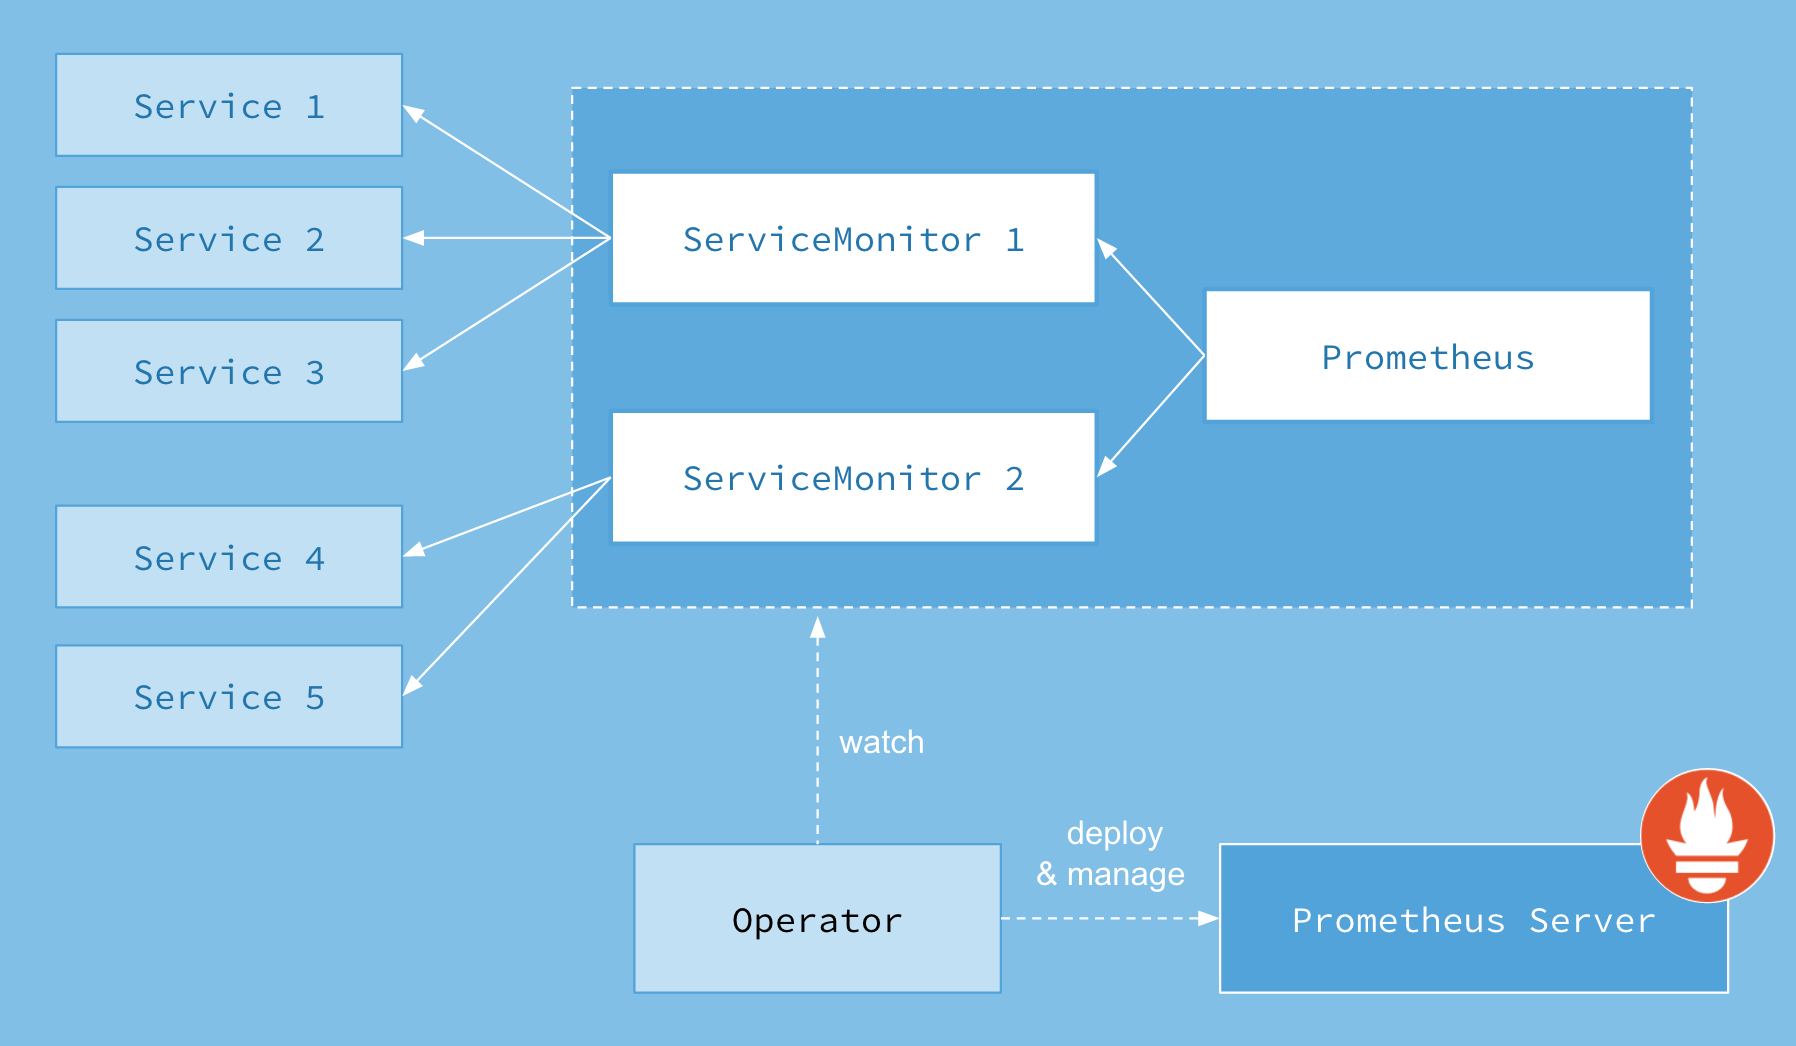
上圖是 Prometheus-Operator 官方提供的架構圖,其中 Operator 是最核心的部分,作爲一個控制器,他會去創建 Prometheus 、 ServiceMonitor 、 AlertManager 以及 PrometheusRule 4個 CRD 資源對象,然後會一直監控並維持這4個資源對象的狀態。
其中創建的 prometheus 這種資源對象就是作爲 Prometheus Server 存在,而 ServiceMonitor 就是 exporter 的各種抽象, exporter是用來提供專門提供 metrics 數據接口的工具, Prometheus 就是通過 ServiceMonitor 提供的 metrics 數據接口去 pull 數據的。
當然 alertmanager 這種資源對象就是對應的 AlertManager 的抽象,而 PrometheusRule 是用來被 Prometheus 實例使用的報警規則文件。
二、說明
-
本文檔基於Prometheus Operator對Prometheus監控系統而進行,完整的配置文件請參考https://github.com/coreos/prometheus-operator
- 本文使用的k8s集羣是基於kubeadm搭建的,具體搭建的詳細請參考https://blog.51cto.com/billy98/2350660
三、部署
1. 環境準備
配置Prometheus-Operator之前需要先準備以下幾個環境:
- Helm環境:請參考https://blog.51cto.com/billy98/2338415
- gluster-heketi環境:因爲prometheus和alertmanager都是有狀態的statefulsets集羣,所以需要使用到公共存儲。請參考https://blog.51cto.com/billy98/2337874
- Ingress環境:請參考https://blog.51cto.com/billy98/2337874
2. 配置域名解析
將alert.cnlinux.club、grafana.cnlinux.club、prom.cnlinux.club三個域名的A記錄解析到負責均衡的IP10.31.90.200。
3. 修改scheduler、controller-manager監聽地址
修改/etc/kubernetes/manifests/ 目錄下kube-controller-manager.yaml和kube-scheduler.yaml
將監聽地址改成--address=0.0.0.0,重啓kubelet服務
systemctl restart kubelet.service 4. 創建Namespace
kubectl create ns monitoring5. 創建Secret
因爲etcd是使用https訪問的,所以prometheus的容器中也必須要etcd的證書去監控etcd集羣,創建Secret就是將證書掛載到prometheus容器中,後續還需要在Prometheus-Operator的配置文件中使用此Secret。
kubectl -n monitoring create secret generic etcd-certs --from-file=/etc/kubernetes/pki/etcd/healthcheck-clien t.crt --from-file=/etc/kubernetes/pki/etcd/healthcheck-client.key --from-file=/etc/kubernetes/pki/etcd/ca.crt 6. 配置Prometheus-Operator
1)首先使用helm下載Prometheus-Operator文件包。
helm fetch stable/prometheus-operator2)解壓下載的壓縮包
tar zxf prometheus-operator-1.8.0.tgz並修改prometheus-operator目錄下的values.yaml。
具體修改的配置如下(配置過多,其他未修改的就不再展示了):
nameOverride: "p"
alertmanager:
  ingress:
    enabled: true
    annotations:
      kubernetes.io/ingress.class: nginx
    labels: {}
    hosts:
      - alert.cnlinux.club
    tls: []
  alertmanagerSpec:
    storage:
      volumeClaimTemplate:
        spec:
          storageClassName: gluster-heketi
          accessModes: ["ReadWriteOnce"]
          resources:
            requests:
              storage: 20Gi
        selector: {}
grafana:
  enabled: true
  adminPassword: admin
    #grafana登錄密碼
  ingress:
    enabled: true
    annotations:
      kubernetes.io/ingress.class: nginx
    labels: {}
    hosts:
      - grafana.cnlinux.club
kubeApiServer:
  enabled: true
  tlsConfig:
    serverName: kubernetes
    insecureSkipVerify: true
  serviceMonitor:
    jobLabel: component
    selector:
      matchLabels:
        component: apiserver
        provider: kubernetes
kubelet:
  enabled: true
  namespace: kube-system
  serviceMonitor:
    https: true
kubeControllerManager:
  enabled: true
  endpoints: []
  service:
    port: 10252
    targetPort: 10252
    selector:
      component: kube-controller-manager
coreDns:
  enabled: true
  service:
    port: 9153
    targetPort: 9153
    selector:
      k8s-app: kube-dns
kubeEtcd:
  enabled: true
  endpoints: []
  service:
    port: 2379
    targetPort: 2379
    selector:
      component: etcd
  serviceMonitor:
    scheme: https
    insecureSkipVerify: false
    serverName: ""
    caFile: /etc/prometheus/secrets/etcd-certs/ca.crt
    certFile: /etc/prometheus/secrets/etcd-certs/healthcheck-client.crt
    keyFile: /etc/prometheus/secrets/etcd-certs/healthcheck-client.key
    #secret etcd-certs掛載在prometheus的路徑是/etc/prometheus/secrets/etcd-certs,證書文件名和secret一樣
kubeScheduler:
  enabled: true
  endpoints: []
  service:
    port: 10251

    targetPort: 10251
    selector:
      component: kube-scheduler
prometheus:
  ingress:
    enabled: true
    annotations:
      kubernetes.io/ingress.class: nginx
    labels: {}
    hosts:
      - prom.cnlinux.club
  prometheusSpec:
    secrets: [etcd-certs]
    #上面步驟創建etcd證書的secret
    storageSpec:
      volumeClaimTemplate:
        spec:
          storageClassName: gluster-heketi
          accessModes: ["ReadWriteOnce"]
          resources:
            requests:
              storage: 20Gi
        selector: {}
3) 安裝prometheus-operator
[root@node-01 ~]# helm install --name p --namespace monitoring ./prometheus-operator
NAME:   p
LAST DEPLOYED: Tue Feb 26 14:30:52 2019
NAMESPACE: monitoring
STATUS: DEPLOYED

RESOURCES:
==> v1beta1/DaemonSet
NAME                        DESIRED  CURRENT  READY  UP-TO-DATE  AVAILABLE  NODE SELECTOR  AGE
p-prometheus-node-exporter  6        6        1      6           1          <none>         5s

==> v1beta2/Deployment
NAME       DESIRED  CURRENT  UP-TO-DATE  AVAILABLE  AGE
p-grafana  1        1        1           0          5s

==> v1/PrometheusRule
NAME                                    AGE
p-alertmanager.rules                    4s
p-etcd                                  4s
p-general.rules                         4s
p-k8s.rules                             4s
p-kube-apiserver.rules                  4s
p-kube-prometheus-node-alerting.rules   4s
p-kube-prometheus-node-recording.rules  4s
p-kube-scheduler.rules                  4s
p-kubernetes-absent                     4s
p-kubernetes-apps                       4s
p-kubernetes-resources                  4s
p-kubernetes-storage                    4s
p-kubernetes-system                     4s
p-node.rules                            4s
p-prometheus-operator                   4s
p-prometheus.rules                      4s

==> v1/Pod(related)
NAME                                  READY  STATUS             RESTARTS  AGE
p-prometheus-node-exporter-48lw9      0/1    Running            0         5s
p-prometheus-node-exporter-7lpvx      0/1    Running            0         5s
p-prometheus-node-exporter-8q577      1/1    Running            0         5s
p-prometheus-node-exporter-ls8cx      0/1    Running            0         5s
p-prometheus-node-exporter-nbl2g      0/1    Running            0         5s
p-prometheus-node-exporter-v7tb5      0/1    Running            0         5s
p-grafana-fcf4dc6bb-9c6pg             0/3    ContainerCreating  0         5s
p-kube-state-metrics-57d788d69-vmh42  0/1    Running            0         5s
p-operator-666b958c4f-wvd4h           1/1    Running            0         5s

==> v1beta1/ClusterRole
NAME                            AGE
p-kube-state-metrics            6s
psp-p-prometheus-node-exporter  6s

==> v1/Service
NAME                        TYPE       CLUSTER-IP      EXTERNAL-IP  PORT(S)    AGE
p-grafana                   ClusterIP  10.245.103.159  <none>       80/TCP     5s
p-kube-state-metrics        ClusterIP  10.245.150.181  <none>       8080/TCP   5s
p-prometheus-node-exporter  ClusterIP  10.245.98.70    <none>       9100/TCP   5s
p-alertmanager              ClusterIP  10.245.10.5     <none>       9093/TCP   5s
p-coredns                   ClusterIP  None            <none>       9153/TCP   5s
p-kube-controller-manager   ClusterIP  None            <none>       10252/TCP  5s
p-kube-etcd                 ClusterIP  None            <none>       2379/TCP   5s
p-kube-scheduler            ClusterIP  None            <none>       10251/TCP  5s
p-operator                  ClusterIP  10.245.31.238   <none>       8080/TCP   5s
p-prometheus                ClusterIP  10.245.109.85   <none>       9090/TCP   5s

==> v1/ClusterRoleBinding
NAME                          AGE
p-grafana-clusterrolebinding  6s
p-alertmanager                6s
p-operator                    6s
p-operator-psp                6s
p-prometheus                  6s
p-prometheus-psp              6s

==> v1beta1/ClusterRoleBinding
NAME                            AGE
p-kube-state-metrics            6s
psp-p-prometheus-node-exporter  6s

==> v1beta1/Role
NAME       AGE
p-grafana  6s

==> v1/RoleBinding
NAME                 AGE
p-prometheus-config  5s
p-prometheus         4s
p-prometheus         4s

==> v1/Deployment
NAME        DESIRED  CURRENT  UP-TO-DATE  AVAILABLE  AGE
p-operator  1        1        1           1          5s

==> v1/Alertmanager
NAME            AGE
p-alertmanager  5s

==> v1/Secret
NAME                         TYPE    DATA  AGE
p-grafana                    Opaque  3     6s
alertmanager-p-alertmanager  Opaque  1     6s

==> v1/ServiceAccount
NAME                        SECRETS  AGE
p-grafana                   1        6s
p-kube-state-metrics        1        6s
p-prometheus-node-exporter  1        6s
p-alertmanager              1        6s
p-operator                  1        6s
p-prometheus                1        6s

==> v1beta1/Deployment
NAME                  DESIRED  CURRENT  UP-TO-DATE  AVAILABLE  AGE
p-kube-state-metrics  1        1        1           0          5s

==> v1beta1/Ingress
NAME            HOSTS                 ADDRESS  PORTS  AGE
p-grafana       grafana.cnlinux.club  80       5s
p-alertmanager  alert.cnlinux.club    80       5s
p-prometheus    prom.cnlinux.club     80       5s

==> v1beta1/PodSecurityPolicy
NAME                        PRIV   CAPS      SELINUX   RUNASUSER  FSGROUP    SUPGROUP  READONLYROOTFS  VOLUMES
p-grafana                   false  RunAsAny  RunAsAny  RunAsAny   RunAsAny   false     configMap,emptyDir,projected,secret,downwardAPI,persistentVolumeClaim
p-prometheus-node-exporter  false  RunAsAny  RunAsAny  MustRunAs  MustRunAs  false     configMap,emptyDir,projected,secret,downwardAPI,persistentVolumeClaim,hostPath
p-alertmanager              false  RunAsAny  RunAsAny  MustRunAs  MustRunAs  false     configMap,emptyDir,projected,secret,downwardAPI,persistentVolumeClaim
p-operator                  false  RunAsAny  RunAsAny  MustRunAs  MustRunAs  false     configMap,emptyDir,projected,secret,downwardAPI,persistentVolumeClaim
p-prometheus                false  RunAsAny  RunAsAny  MustRunAs  MustRunAs  false     configMap,emptyDir,projected,secret,downwardAPI,persistentVolumeClaim

==> v1/ConfigMap
NAME                         DATA  AGE
p-grafana-config-dashboards  1     6s
p-grafana                    1     6s
p-grafana-datasource         1     6s
p-etcd                       1     6s
p-grafana-coredns-k8s        1     6s
p-k8s-cluster-rsrc-use       1     6s
p-k8s-node-rsrc-use          1     6s
p-k8s-resources-cluster      1     6s
p-k8s-resources-namespace    1     6s
p-k8s-resources-pod          1     6s
p-nodes                      1     6s
p-persistentvolumesusage     1     6s
p-pods                       1     6s
p-statefulset                1     6s

==> v1beta1/RoleBinding
NAME       AGE
p-grafana  5s

==> v1/Prometheus
NAME          AGE
p-prometheus  4s

==> v1/ServiceMonitor
NAME                       AGE
p-alertmanager             4s
p-coredns                  4s
p-apiserver                4s
p-kube-controller-manager  4s
p-kube-etcd                4s
p-kube-scheduler           4s
p-kube-state-metrics       4s
p-kubelet                  4s
p-node-exporter            4s
p-operator                 4s
p-prometheus               4s

==> v1/ClusterRole
NAME                   AGE
p-grafana-clusterrole  6s
p-alertmanager         6s
p-operator             6s
p-operator-psp         6s
p-prometheus           6s
p-prometheus-psp       6s

==> v1/Role
NAME                 AGE
p-prometheus-config  6s
p-prometheus         4s
p-prometheus         4s

NOTES:
The Prometheus Operator has been installed. Check its status by running:
  kubectl --namespace monitoring get pods -l "release=p"

Visit https://github.com/coreos/prometheus-operator for instructions on how
to create & configure Alertmanager and Prometheus instances using the Operator.
6. 部署中遇到的問題
在部署中有幾個坑,我在此列舉一下,大家配置的時候需要注意一下
1)名稱過長導致pvc創建失敗
由於alertmanager和prometheus都是有狀態的statefulsets,所以我們使用了gluster的存儲,並通過 prometheus-operator自動創建pvc,如果charts的release 名稱過長會導致pvc創建失敗。
所以在上面的安裝中指定了release的名字爲phelm install --name p --namespace monitoring ./prometheus-operator,並且在配置文件中也修改了namenameOverride: "p"。
Warning    ProvisioningFailed  3s (x2 over 40s)  persistentvolume-controller  Failed to provision volume with StorageClass "gluster-heketi": failed to create volume: failed to create endpoint/service
default/glusterfs-dynamic-72488422-3428-11e9-a74b-005056824bdc: failed to create endpoint: Endpoints "glusterfs-dynamic-72488422-3428-11e9-a74b-005056824bdc" is invalid:
metadata.labels: Invalid value: "alertmanager-prom-alertmanager-db-alertmanager-prom-alertmanager-0": must be no more than 63 characters
2)配置文件中labels
首先要查看pod的標籤,然後修改修改prometheus-operator目錄下的values.yaml對應的標籤。
[root@node-01 ~]# kubectl -n kube-system get pod --show-labels
NAME                                        READY   STATUS    RESTARTS   AGE     LABELS
coredns-7f65654f74-6gxps                    1/1     Running   8          5d22h   k8s-app=kube-dns,pod-template-hash=7f65654f74
etcd-node-01                                1/1     Running   1          32d     component=etcd,tier=control-plane
kube-controller-manager-node-01             1/1     Running   0          39h     component=kube-controller-manager,tier=control-plane
kube-scheduler-node-01                      1/1     Running   0          23h     component=kube-scheduler,tier=control-plane
...
需要注意的是一定要修改prometheus-operator目錄下values.yaml對應的標籤,不能在安裝的時候指定外部的配置文件來覆蓋labels值,這可能是個bug,指定外部配置時無法覆蓋labels而是追加,會導致prometheus無法抓取到數據。
7. 更新和刪除
如果在修改了配置文件values.yaml,可以使用以下命令更新prometheus-operator
helm upgrade RELEASE_NAME ./prometheus-operator如果需要刪除,可以使用以下命令
helm del --purge RELEASE_NAME
kubectl -n monitoring delete crd prometheuses.monitoring.coreos.com
kubectl -n monitoring delete crd prometheusrules.monitoring.coreos.com
kubectl -n monitoring delete crd servicemonitors.monitoring.coreos.com
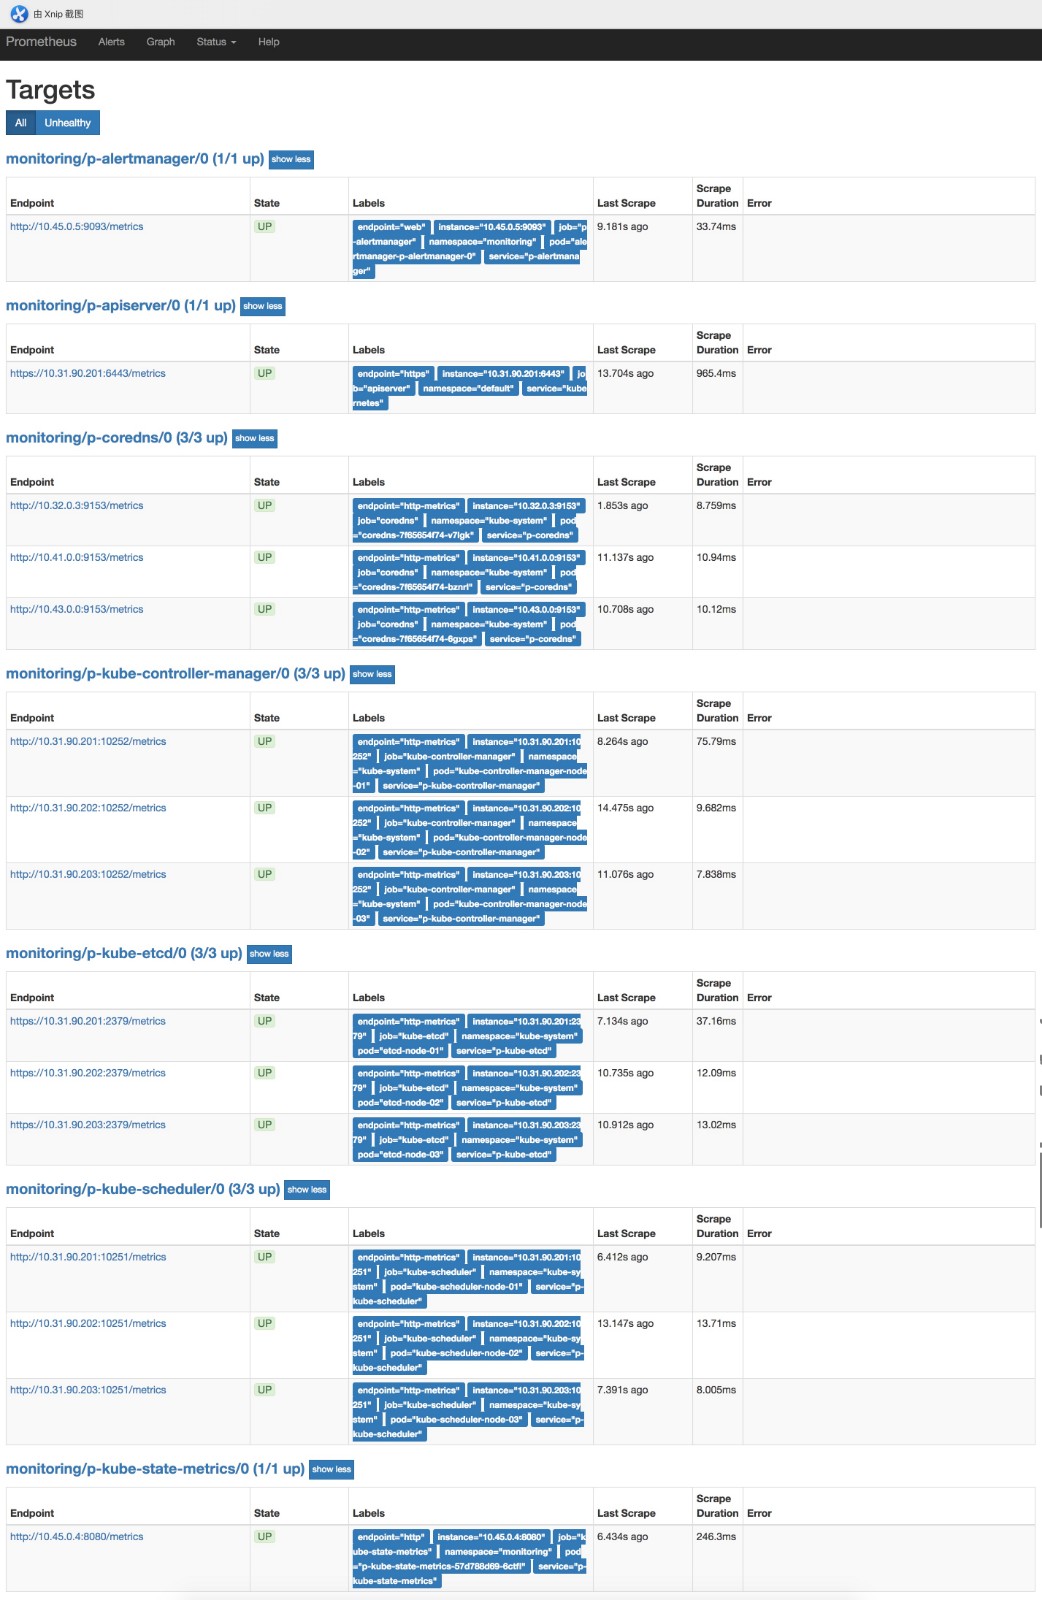
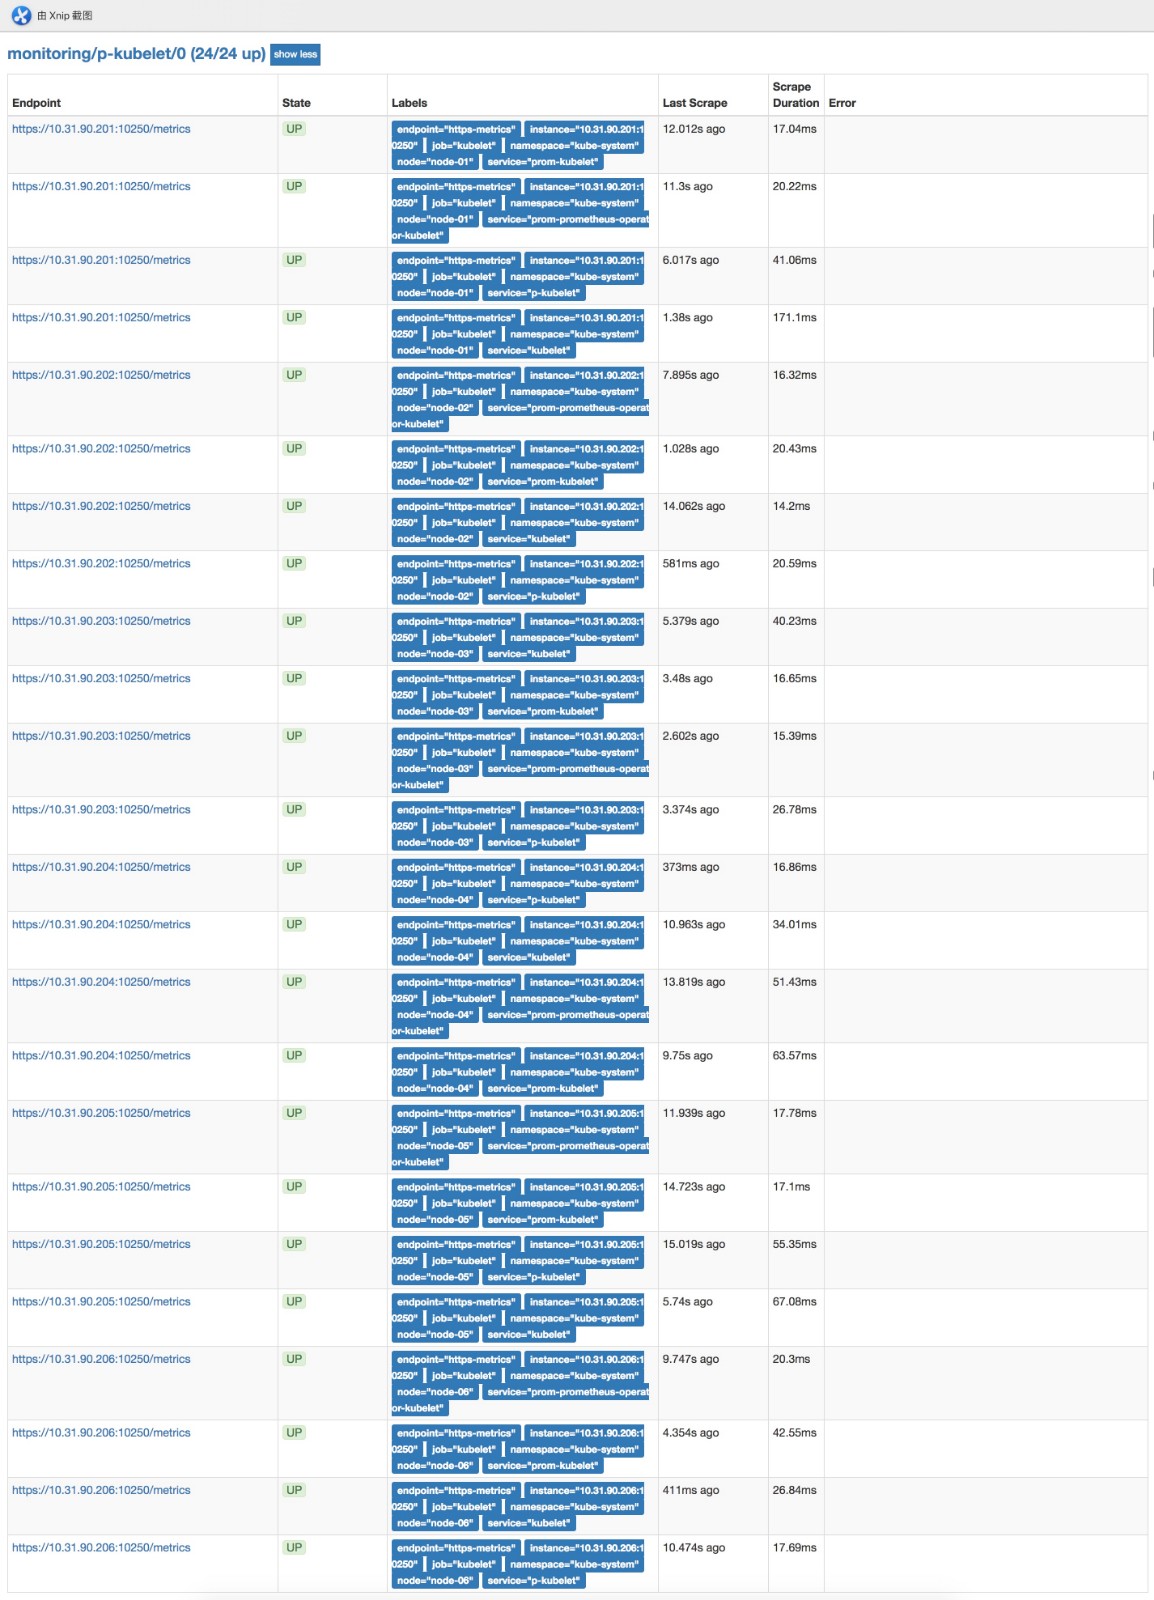
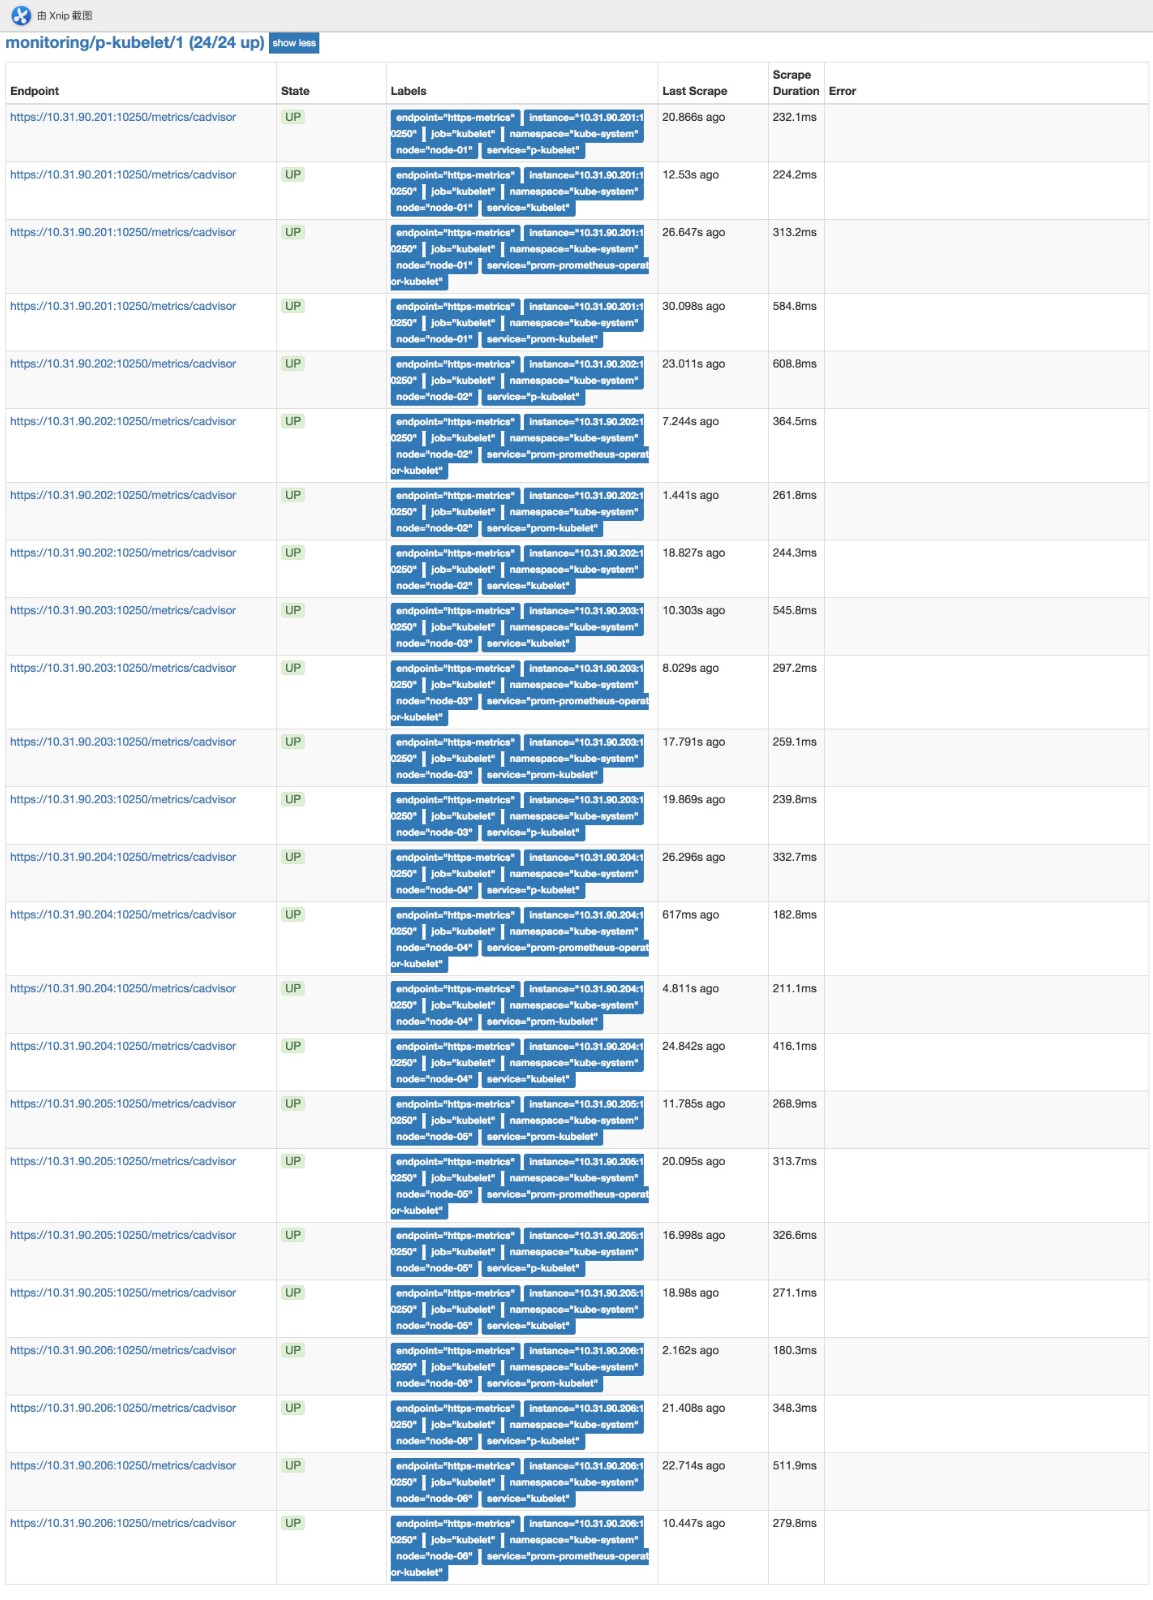
kubectl -n monitoring delete crd alertmanagers.monitoring.coreos.com8. 驗證
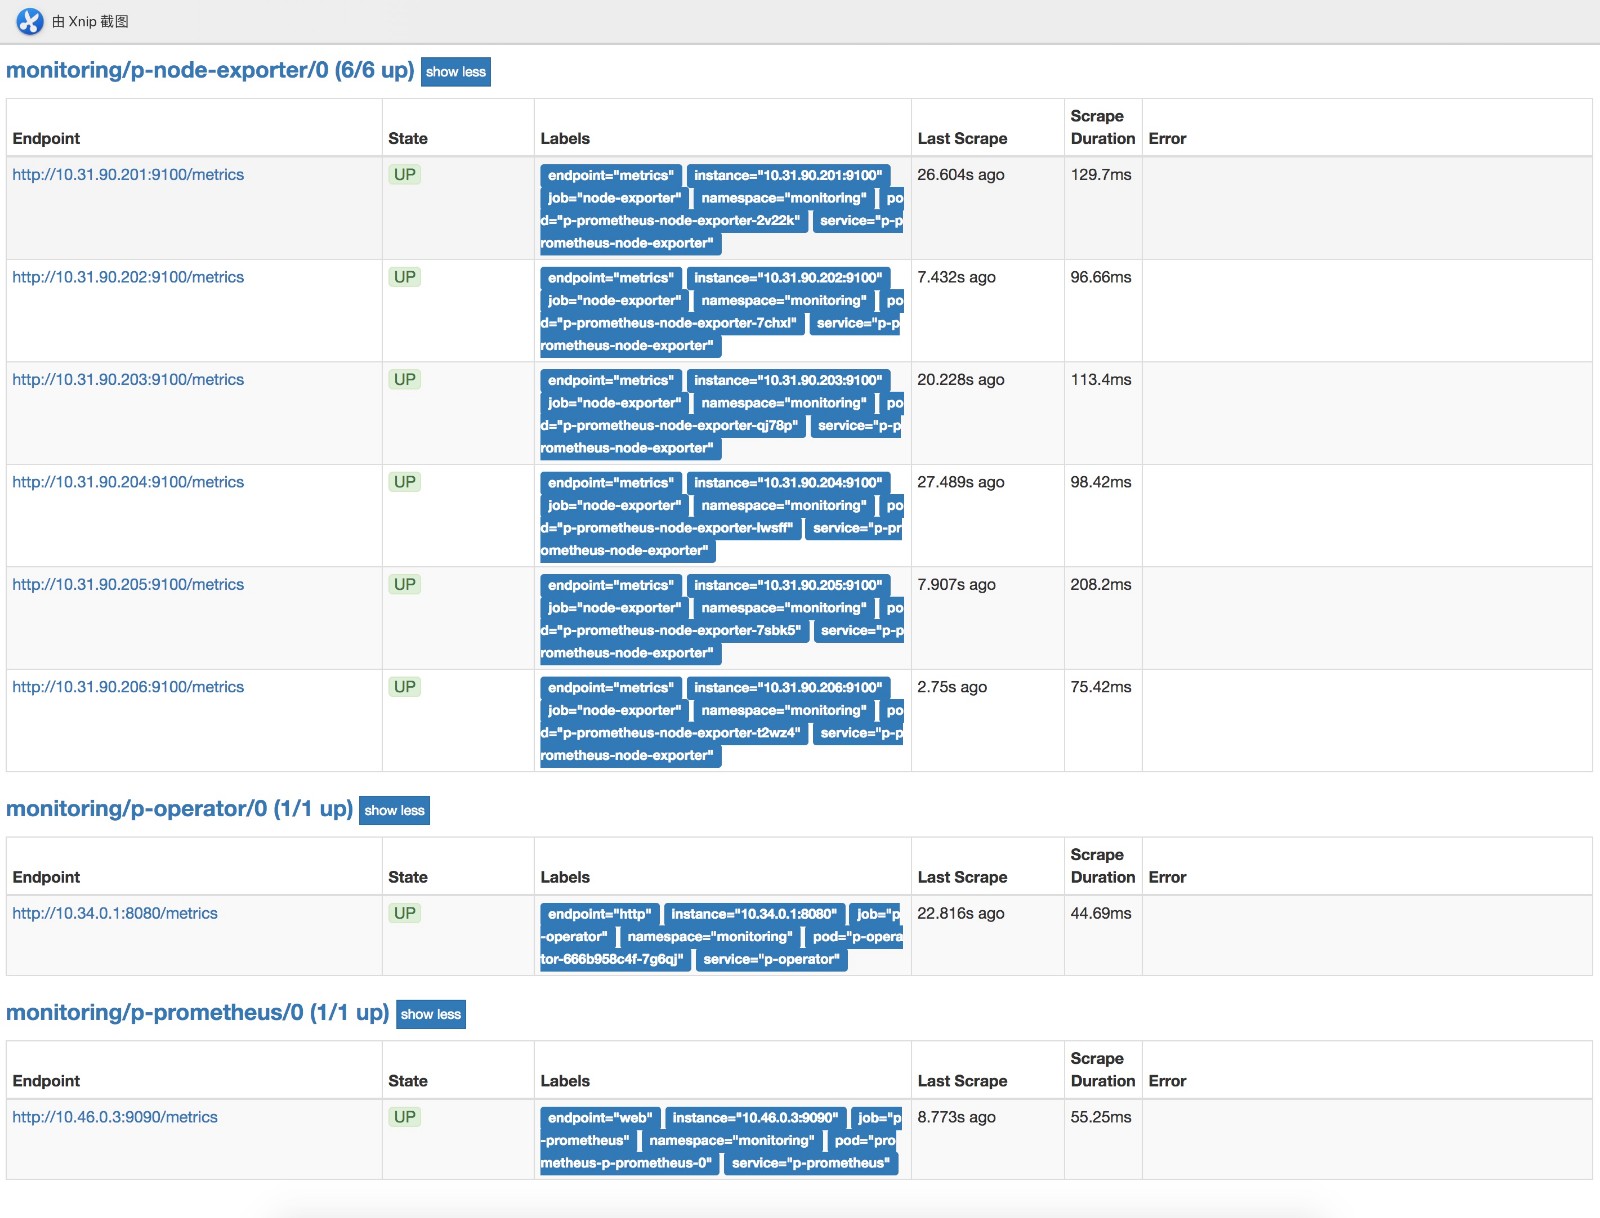
部署完後可以在瀏覽器訪問prometheushttp://prom.cnlinux.club/targets,可以看到如下圖,所有的項都有數據,並且是UP狀態的。
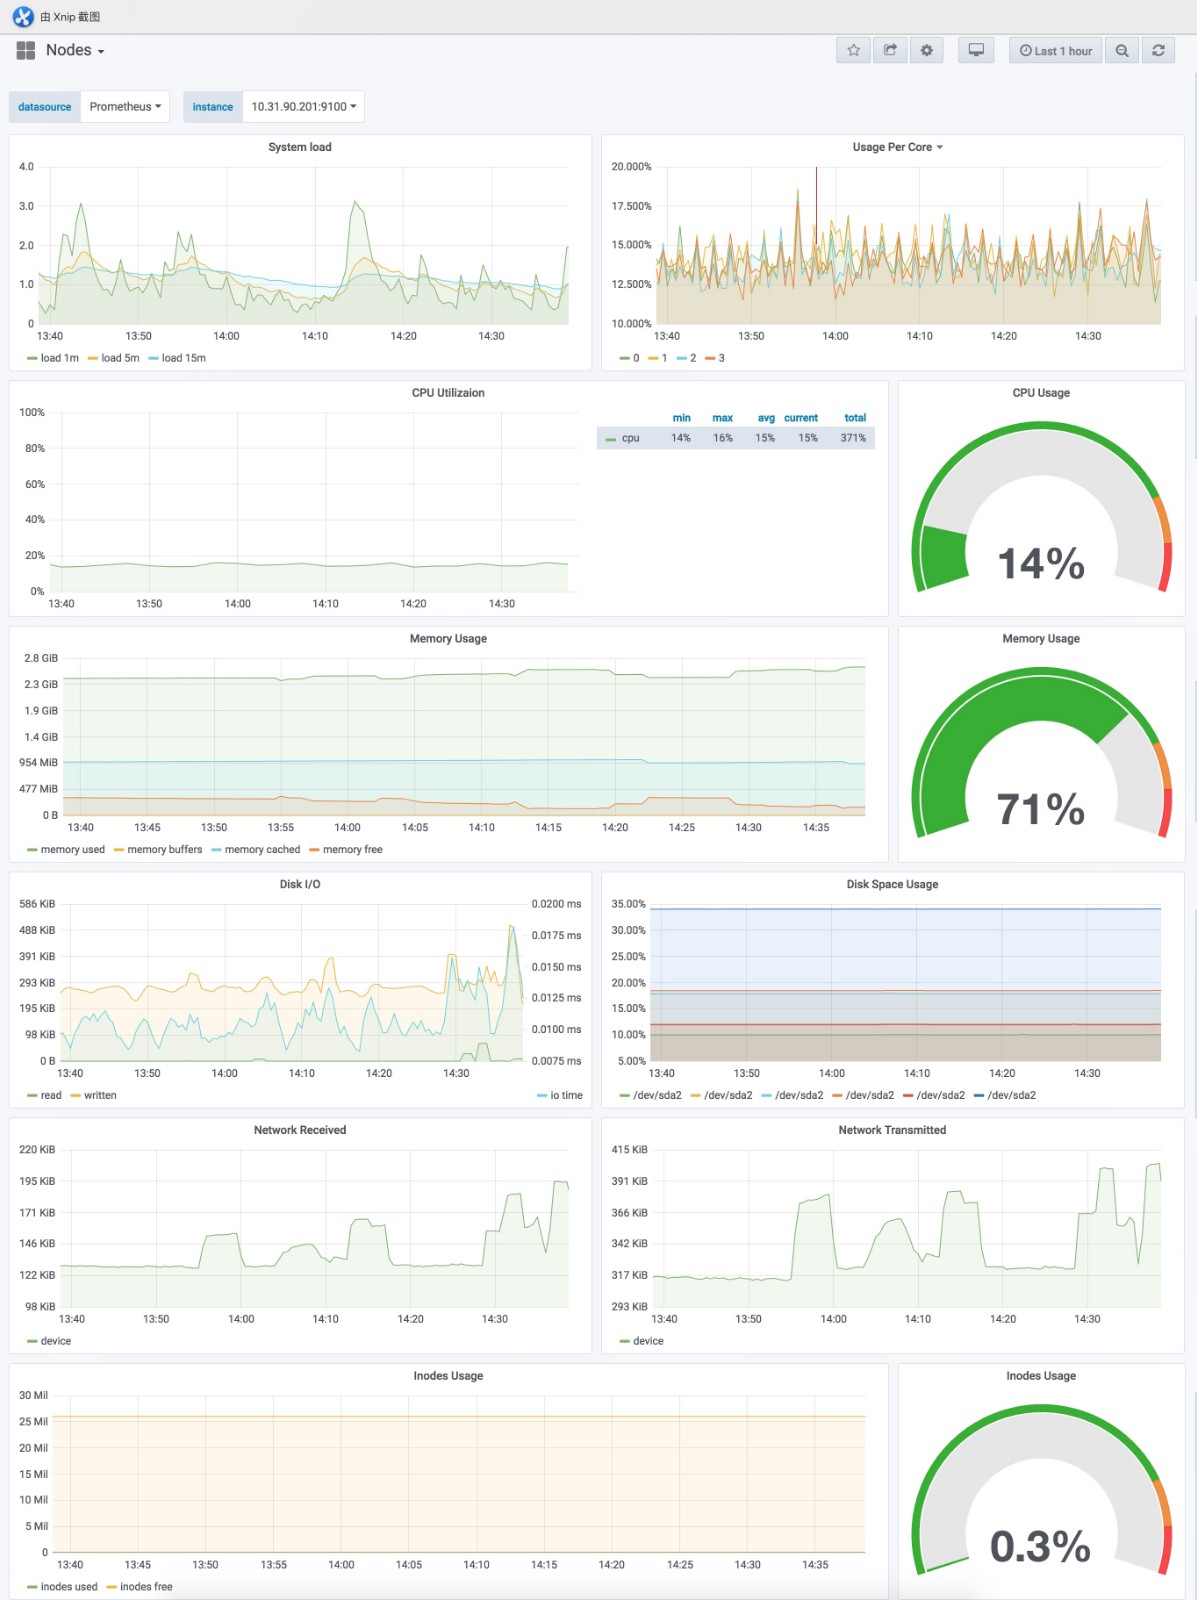
瀏覽器訪問grafana http://grafana.cnlinux.club/,可以看到各種資源的監控圖。
用戶名爲admin,密碼爲values.yaml配置文件中指定的密碼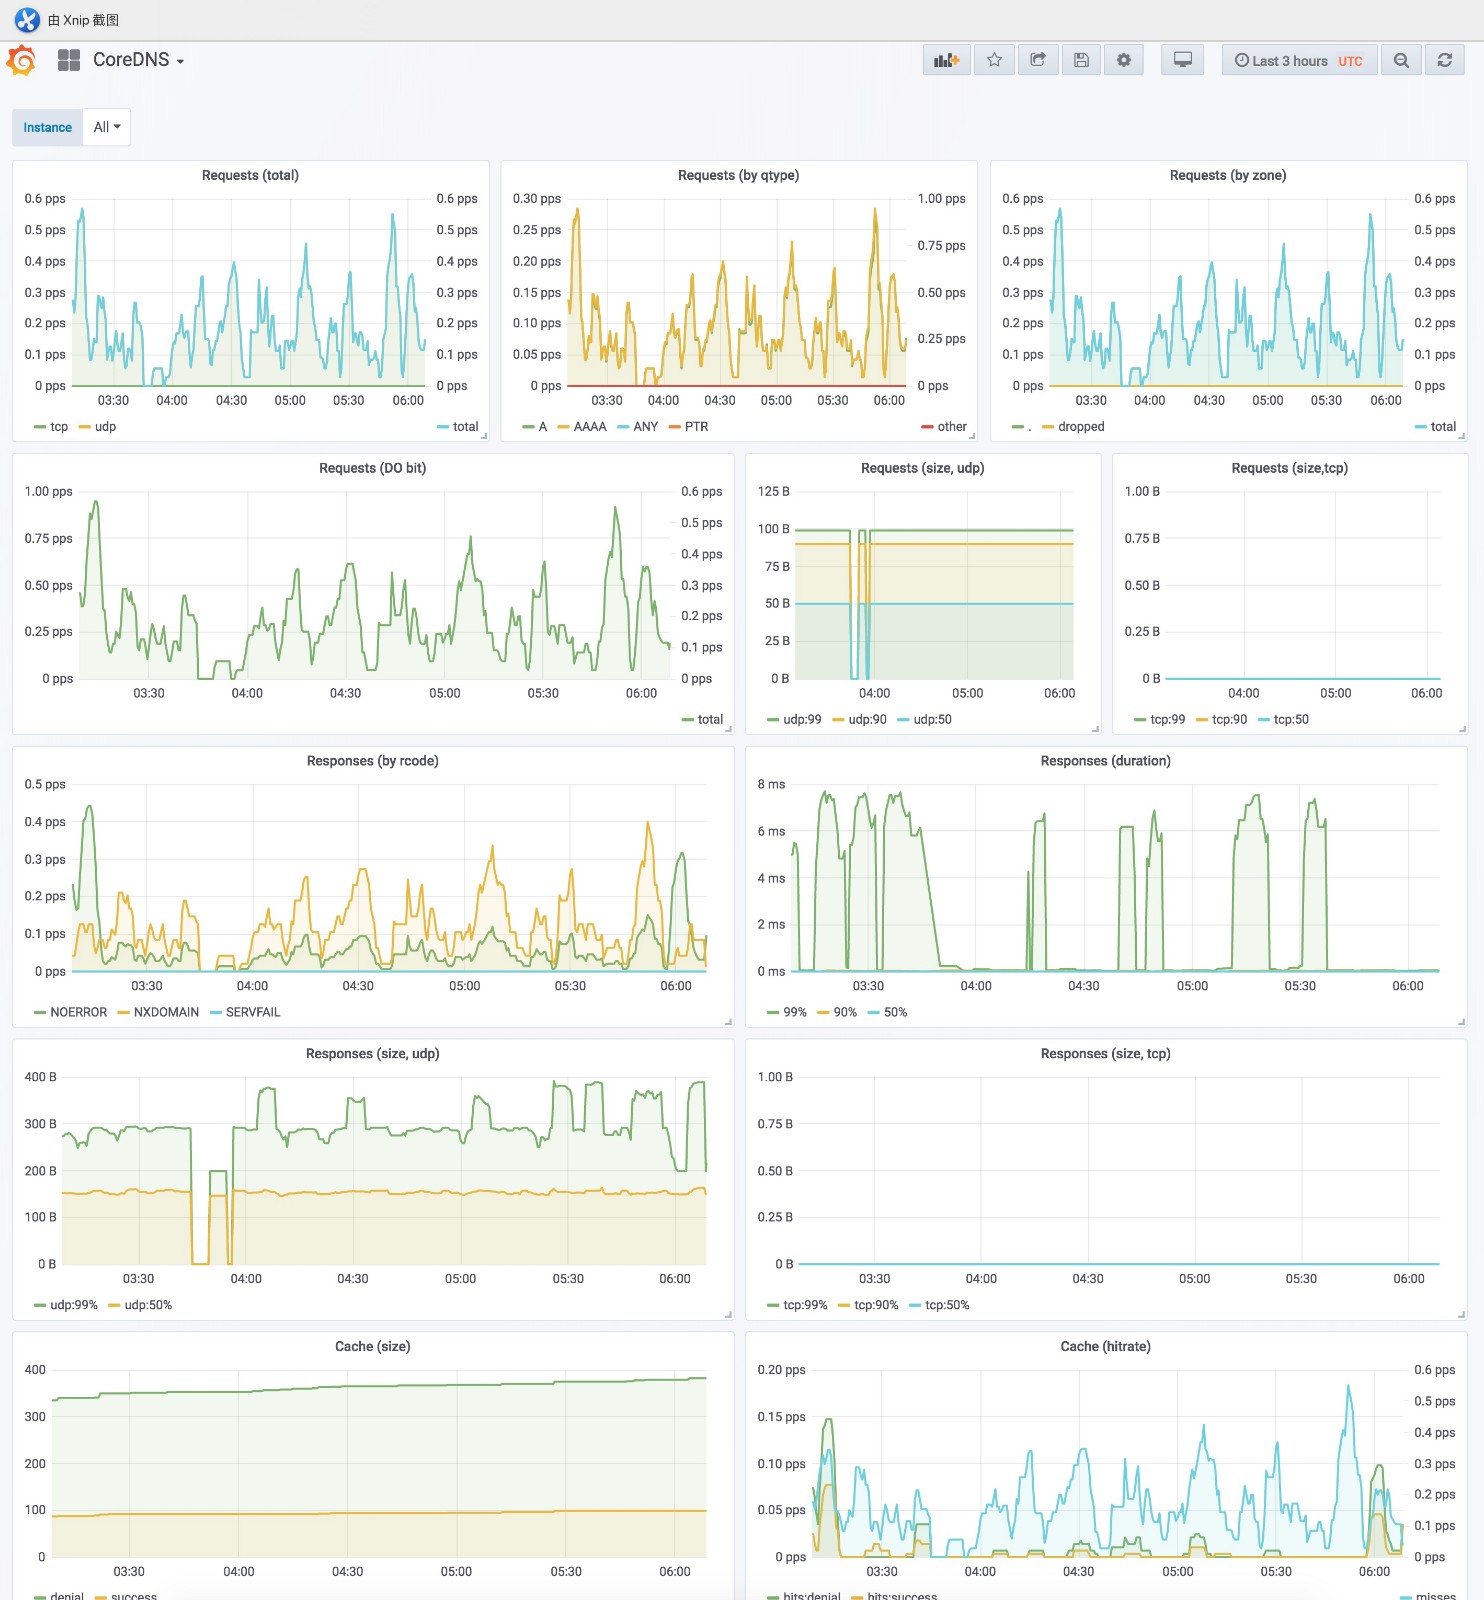
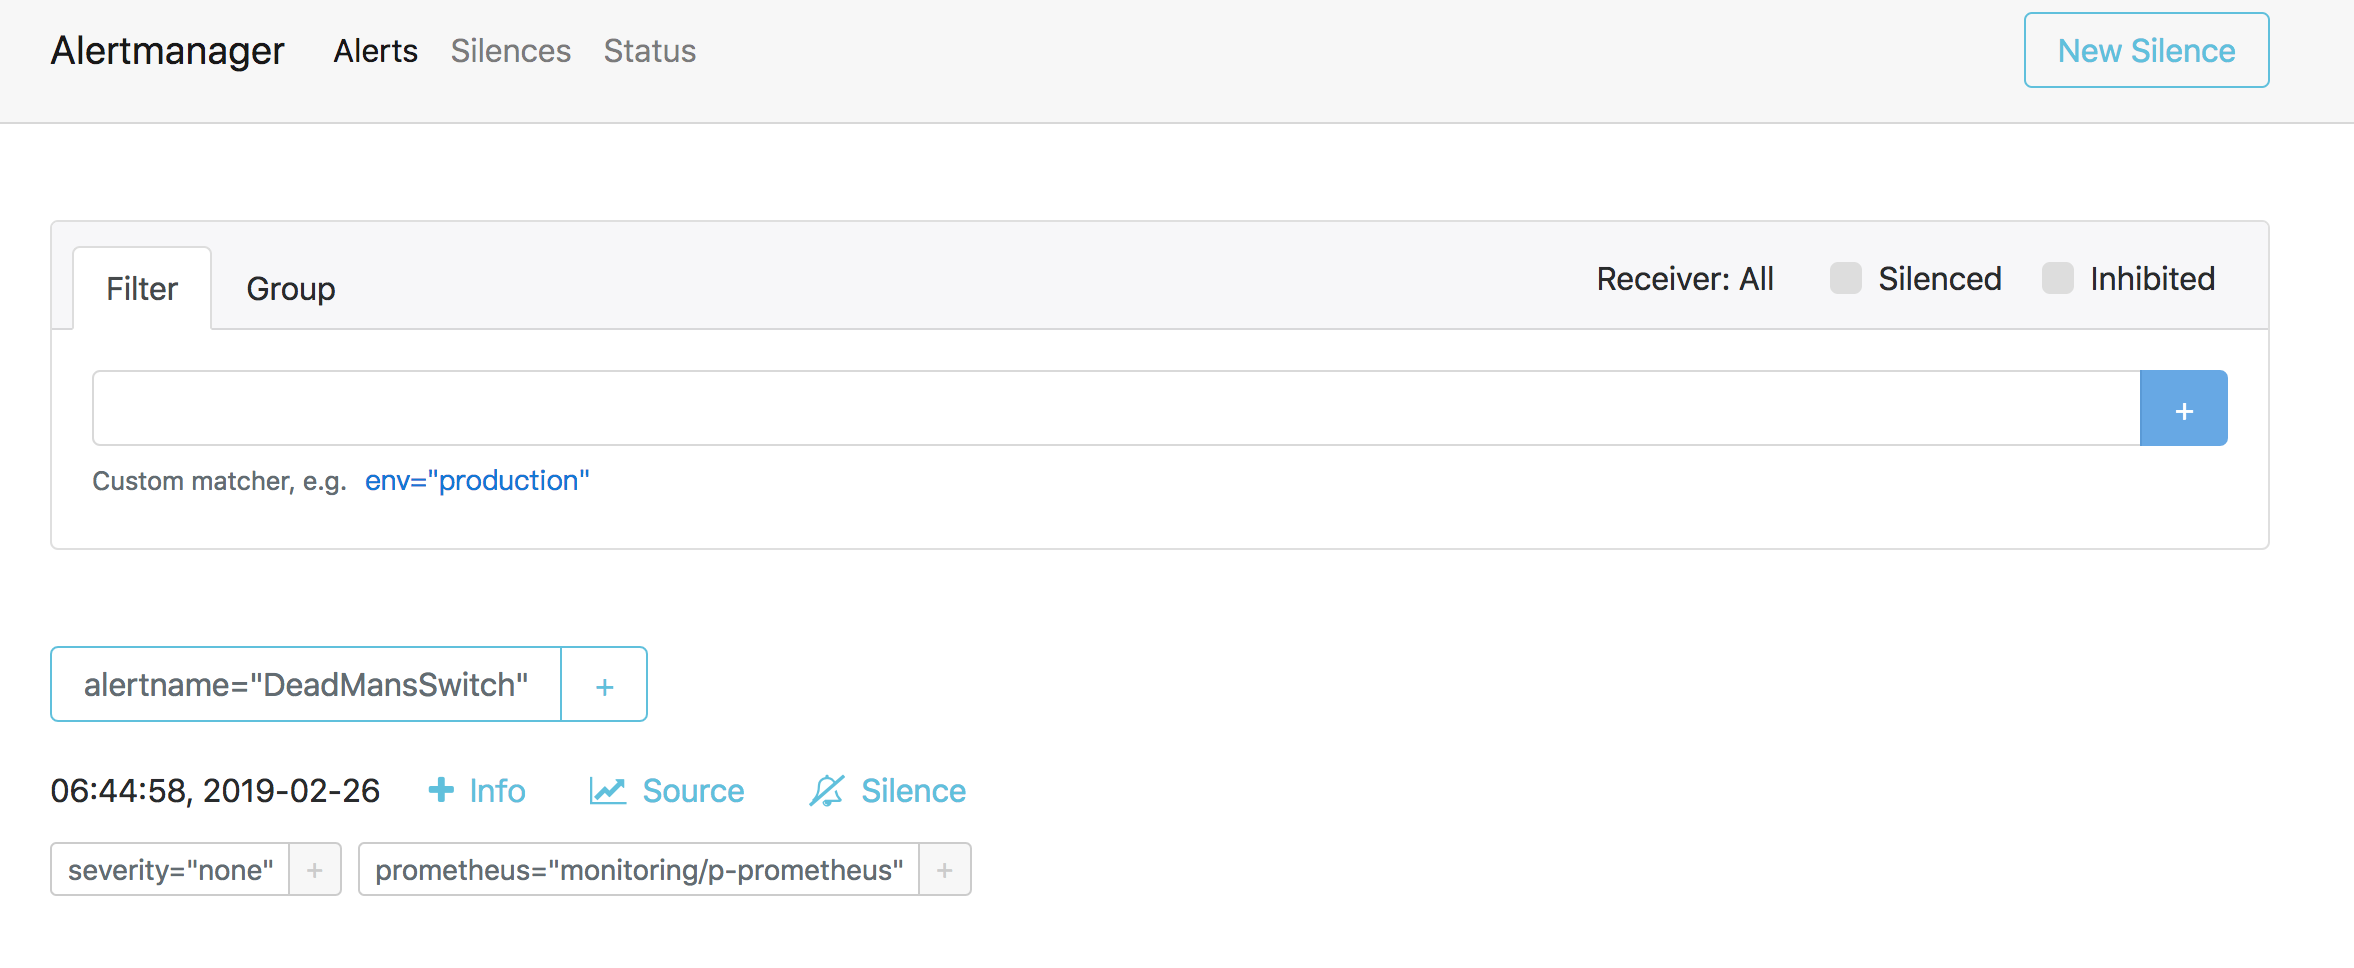
瀏覽器訪問Alertmanagerhttp://alert.cnlinux.club/,可以看到報警項。
至此所有的安裝完成,下一篇將詳細說明使用prometheus監控自定義服務,以及報警設置。如有問題歡迎在下面留言交流。希望大家多多關注和點贊,謝謝!