#(1)安裝mysqld exporter ,
作用: mysqld exporter的功能是收集mysql服務器的數據, 並向外提供api接口, 用於prometheus主要獲取數據;
1)在被監控端mysql服務器上創建賬號用於mysql exporter收集使用
GRANT REPLICATION CLIENT, PROCESS ON  *.*  to 'exporter'@'%' identified by '123456';
GRANT SELECT ON performance_schema.* TO 'exporter'@'%';
flush privileges;
2)在被監控端mysql服務器上安裝mysql exporter, 這裏我使用二進制方式安裝
docker run -d --restart=always --name mysqld-exporter -p 9104:9104 -e DATA_SOURCE_NAME="user:password@(hostname:port)/" prom/mysqld-exporter
docker run -d --restart=always --name mysqld-exporter -p 9104:9104 -e DATA_SOURCE_NAME="exporter:123456@(192.168.1.82:3306)/" prom/mysqld-exporter
要查看容器是否報錯, 主要是驗證exporter與mysql服務端之間正常連接和獲取數據;
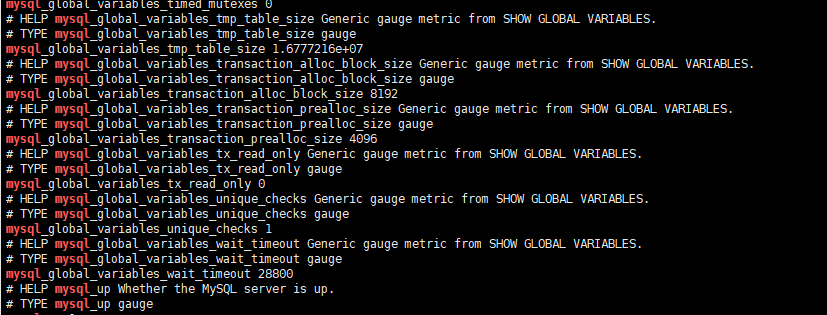
docker logs -f mysqld-exporter 看有沒有報錯3)驗證
curl http://192.168.1.62:9104/metrics 能夠看到很多mysql相關數據
#(2)安裝consul
consul作用: 服務註冊中心,向外提供服務的增刪api接口, prometheus可以向consul動態獲取節點信息以及自動加載配置
1)docker安裝consul
docker run --restart=always --name consul -d -p 8500:8500 consul2)向consul的api接口添加服務
curl -X PUT -d '{"id": "mysql62","name": "mysql62","address": "192.168.1.62","port": 9104,"tags": ["test"],"checks": [{"http": "http://192.168.1.62:9104/","interval": "5s"}]}'     http://localhost:8500/v1/agent/service/register
curl -X PUT -d '{"id": "mysql82","name": "mysql82","address": "192.168.1.82","port": 9104,"tags": ["test"],"checks": [{"http": "http://192.168.1.82:9104/","interval": "5s"}]}'     http://localhost:8500/v1/agent/service/register
consul上服務能夠正常註冊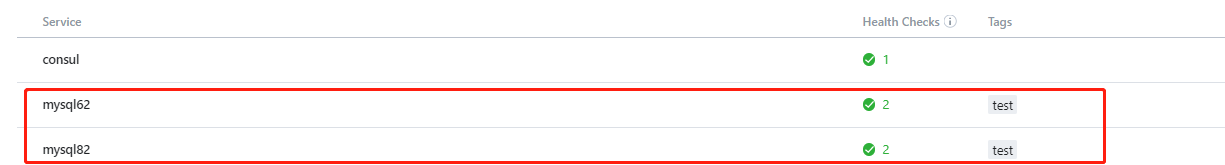
#(3)安裝和配置altermanger
altermanager作用: 接收prometheus發送的告警信息, 通過相關方式例如郵件和微信等方式發送給接收者;
0)準備目錄
test -d /etc/alertmanager || mkdir -pv /etc/alertmanager1)準備配置文件
# cat /etc/alertmanager/alertmanager.yml
global:
    resolve_timeout: 5m

templates:
- '/etc/alertmanager/wechat.tmpl'

route:
    group_by: ['alertname']
    group_wait: 10s
    group_interval: 10s
    repeat_interval: 1h
    receiver: 'wechat'
receivers:
- name: 'wechat'
    wechat_configs:
    - corp_id: 'wwc08fcb42fc6fe93c'
        to_party: '2'
        agent_id: '1000002'
        api_secret: 'cLG91Xgcd3o3zPJp6NbOJV9m7SBIlhtCScxov3Hp-XQ'
        send_resolved: true
2)準備模板文件
# cat /etc/alertmanager/wechat.tmpl
{{ define "wechat.default.message" }}
{{ if gt (len .Alerts.Firing) 0 -}}
Alerts Firing:
{{ range .Alerts }}
告警級別:{{ .Labels.severity }}
告警類型:{{ .Labels.alertname }}
故障主機: {{ .Labels.instance }}
告警主題: {{ .Annotations.summary }}
告警詳情: {{ .Annotations.description }}
觸發時間: {{ .StartsAt.Format "2006-01-02 15:04:05" }}
{{- end }}
{{- end }}
{{ if gt (len .Alerts.Resolved) 0 -}}
Alerts Resolved:
{{ range .Alerts }}
告警級別:{{ .Labels.severity }}
告警類型:{{ .Labels.alertname }}
故障主機: {{ .Labels.instance }}
告警主題: {{ .Annotations.summary }}
觸發時間: {{ .StartsAt.Format "2006-01-02 15:04:05" }}
恢復時間: {{ .EndsAt.Format "2006-01-02 15:04:05" }}
{{- end }}
{{- end }}
告警鏈接:
{{ template "__alertmanagerURL" . }}
{{- end }}
3)啓動容器
docker run --restart=always -d -p 9093:9093 -v /etc/alertmanager/alertmanager.yml:/etc/alertmanager/alertmanager.yml -v /etc/alertmanager/wechat.tmpl:/etc/alertmanager/wechat.tmpl --name alertmanager prom/alertmanager4)驗證容器是否有報錯
docker logs -f alertmanager
打開網頁進行驗證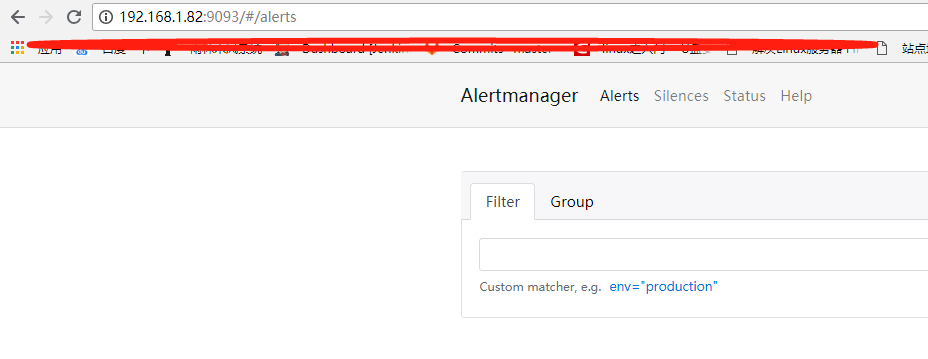
#(4)安裝和配置prometheus
prometheus作用: 用於向exporter獲取數據並保存數據, 同時可以設置規則和觸發器, 向報警器發送信息;
1)準備目錄
test -d /etc/prometheus || mkdir /etc/prometheus -pv2)準備prometheus配置文件
rule_files : 報警規則文件
alerting: 當觸發報警, 把報警相關發送給altermanager, 由altermanager接收告警信息在發送給接收人;
job_name: consul : prometheus 向consul註冊;
#cat /etc/prometheus/prometheus.yml
global:
    scrape_interval:     15s
    evaluation_interval: 15s
rule_files:
    - "/etc/prometheus/*.rules"
alerting:
    alertmanagers:
    - static_configs:
        - targets:
            - "192.168.1.82:9093"
scrape_configs:
    - job_name: prometheus
        static_configs:
            - targets: ['localhost:9090']
                labels:
                    instance: prometheus
    - job_name: 'consul'
        consul_sd_configs:
            - server: '192.168.1.82:8500'
                services: []

        relabel_configs:
            - source_labels: [__meta_consul_tags]
                regex: .*test.*
                action: keep
3)準備mysql告警規則文件 , 注意該文件不能有tag鍵, 同時key和value之間必須要有空格
#cat /etc/prometheus/prometheus.rules
groups:
- name: MySQLStatsAlert
    rules:
    - alert: MySQL is down
        expr: mysql_up == 0
        for: 1m
        labels:
            severity: critical
        annotations:
            summary: "Instance {{ $labels.instance }} MySQL is down"
            description: "MySQL database is down. This requires immediate action!"

    - alert: Mysql_High_QPS
        expr: rate(mysql_global_status_questions[5m]) > 500
        for: 2m
        labels:
            severity: warning
        annotations:
            summary: "{{$labels.instance}}: Mysql_High_QPS detected"
            description: "{{$labels.instance}}: Mysql opreation is more than 500 per second ,(current value is: {{ $value }})"
    - alert: Mysql_Too_Many_Connections
        expr: rate(mysql_global_status_threads_connected[5m]) > 200
        for: 2m
        labels:
            severity: warning
        annotations:
            summary: "{{$labels.instance}}: Mysql Too Many Connections detected"
            description: "{{$labels.instance}}: Mysql Connections is more than 100 per second ,(current value is: {{ $value }})"

    - alert: Mysql_Too_Many_slow_queries
        expr: rate(mysql_global_status_slow_queries[5m]) > 3
        for: 2m
        labels:
            severity: warning
        annotations:
            summary: "{{$labels.instance}}: Mysql_Too_Many_slow_queries detected"
            description: "{{$labels.instance}}: Mysql slow_queries is more than 3 per second ,(current value is: {{ $value }})"

    - alert: SQL thread stopped
        expr: mysql_slave_status_slave_sql_running != 1
        for: 1m
        labels:
            severity: critical
        annotations:
            summary: "Instance {{ $labels.instance }} Sync Binlog is enabled"
            description: "SQL thread has stopped. This is usually because it cannot apply a SQL statement received from the master."
    - alert: Slave lagging behind Master
        expr: rate(mysql_slave_status_seconds_behind_master[5m]) >30
        for: 1m
        labels:
            severity: warning
        annotations:
            summary: "Instance {{ $labels.instance }} Slave lagging behind Master"
            description: "Slave is lagging behind Master. Please check if Slave threads are running and if there are some performance issues!"
4)docker方式啓動prometheus
docker run --restart=always --name prometheus -d -p 9090:9090 -v /etc/prometheus:/etc/prometheus prom/prometheus 5)登錄到prometheus驗證
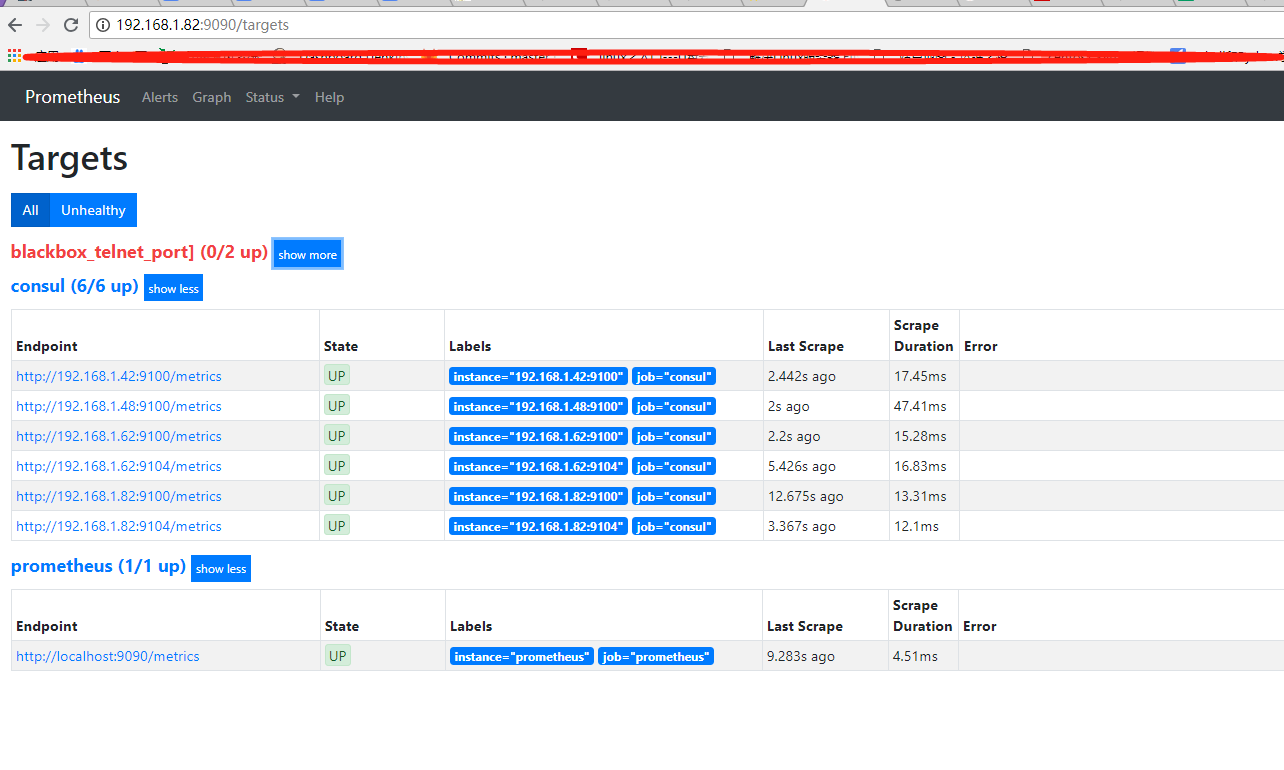
在prometheus上, 能夠看到正常連接到mysqld exporter
mysql相關規則實時生效了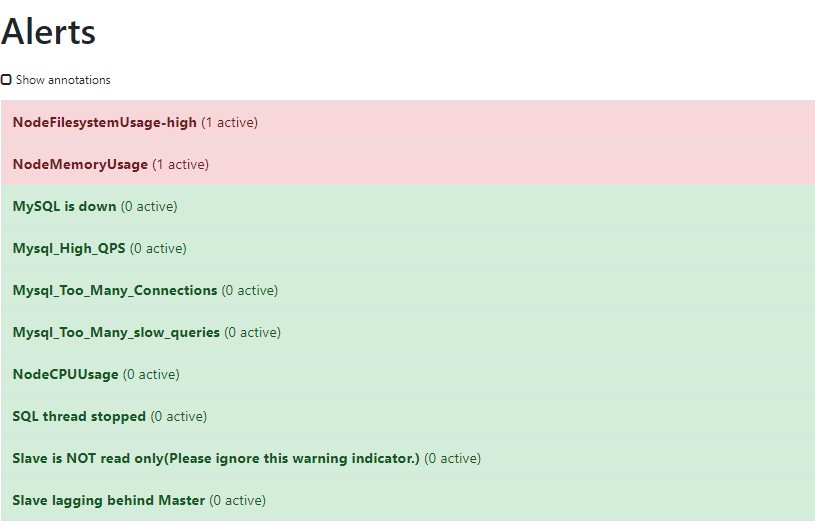
#(4)下載安裝和配置grafana
1)下載和啓動grafana
 wget https://dl.grafana.com/oss/release/grafana-6.0.2-1.x86_64.rpm
 yum  install grafana-6.0.2-1.x86_64.rpm -y
 systemctl start grafana-server
 systemctl enable grafana-server
 ss -anltup |grep 3000
2)添加圖形
https://grafana.com/dashboards 搜索mysql相關dashborad ; 
在import圖形添加相關id 7362 7371
3)驗證圖形
在grafana上能夠正常獲取到數據; 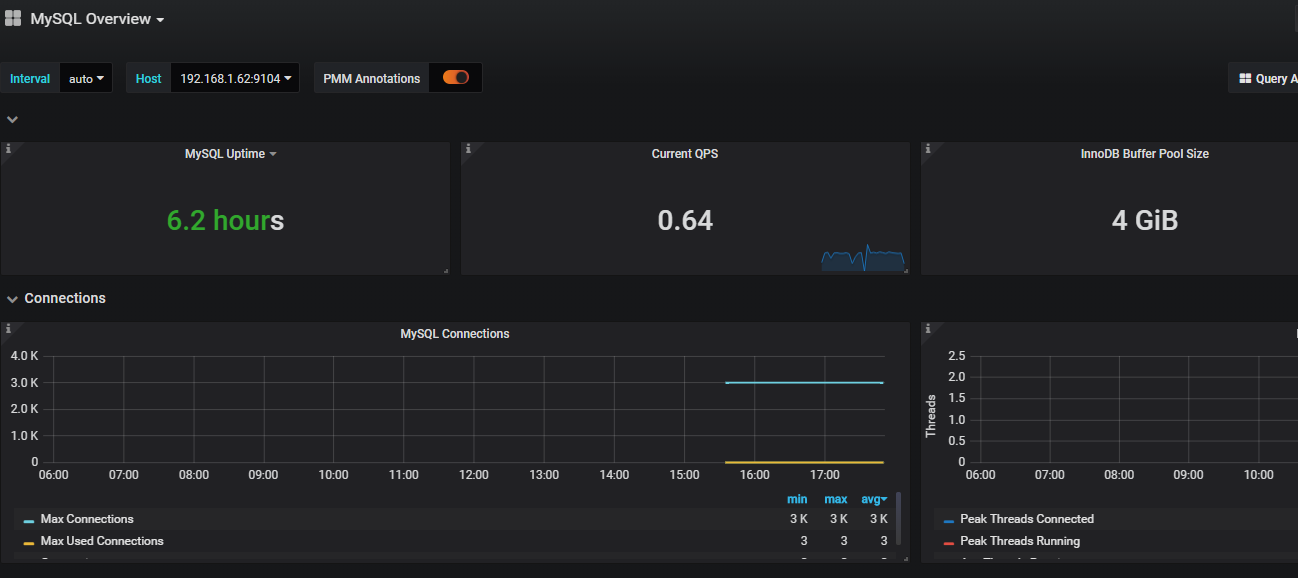
4)驗證報警: 把從庫的mysql實例服務停止
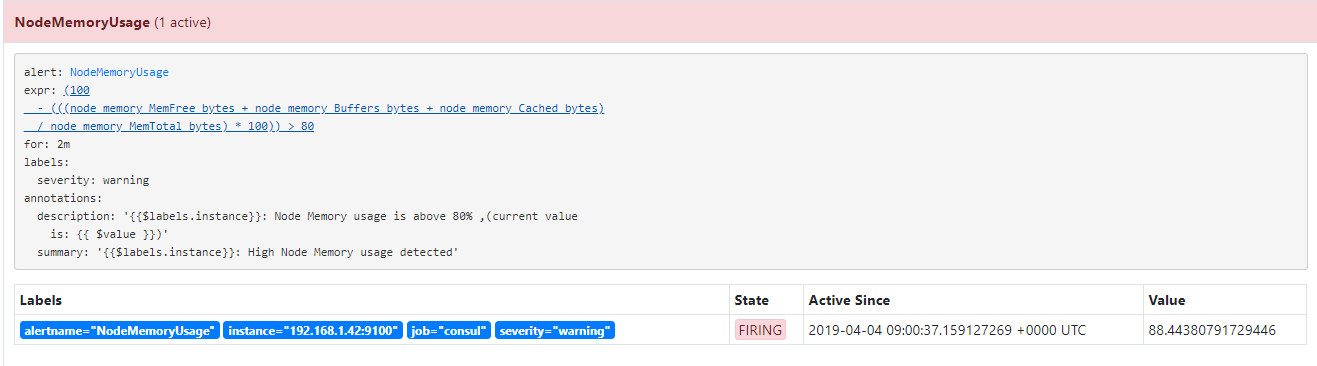
在prometheus的alert界面可以看到有個告警, 處於pending狀態, 當處於firing狀態, 持續時間爲for指定的時間, 向altermanager發送告警;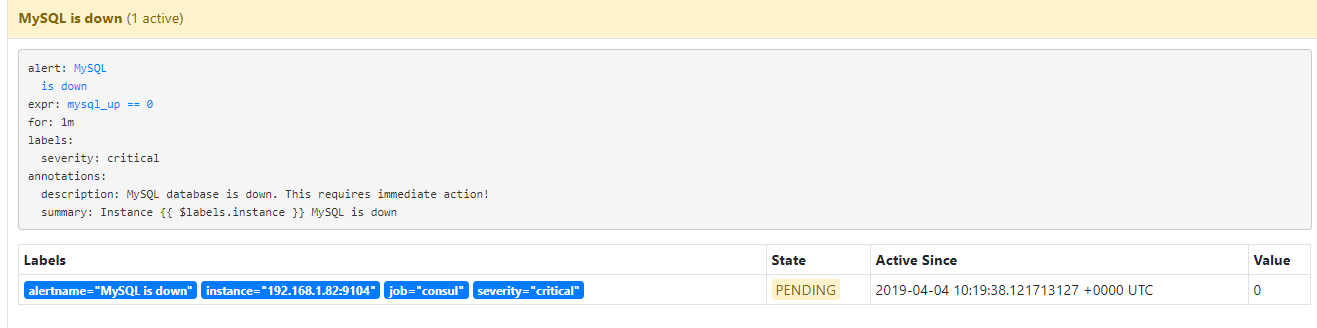
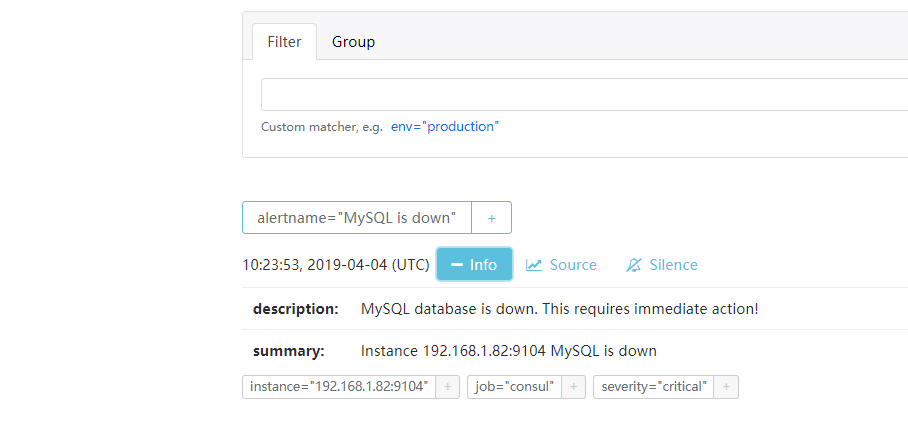
進入altermanager界面, 發現altermanager接收到prometheus發送過來的報警
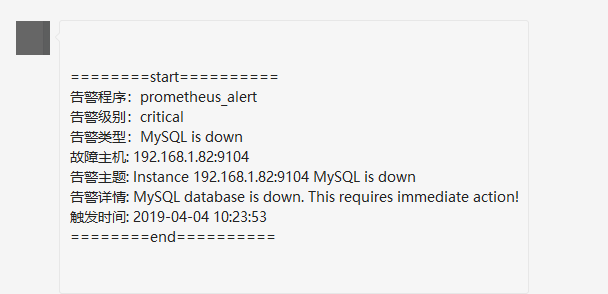
5)查看微信