


文章來源:http://www.blogjava.net/hankchen/archive/2012/05/09/377735.html
一個應用佔用CPU很高,除了確實是計算密集型應用之外,通常原因都是出現了死循環或者死鎖等等
當CPU 100%那麼可能無法直接用jvisualvm等相關工具來連接,那麼如何該排查呢(也可以通過導出堆棧信息到工具分析)。如下案列:
以我們最近出現的一個實際故障爲例,介紹怎麼定位和解決這類問題。
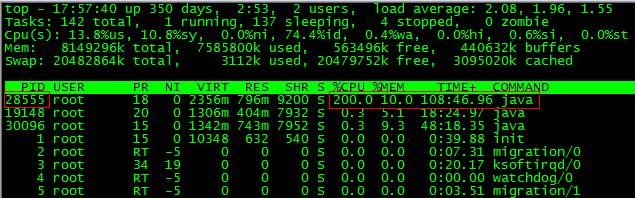
第一步:根據top命令,發現PID爲28555的Java進程佔用CPU高達200%,出現故障。
第二步:通過ps aux | grep PID命令,可以進一步確定是tomcat進程出現了問題。但是,怎麼定位到具體線程或者代碼呢?
第三步:首先顯示線程列表:
ps -mp pid -o THREAD,tid,time

找到了耗時最高的線程28802,佔用CPU時間快兩個小時了!
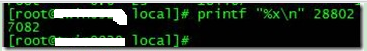
第四步:其次將需要的線程ID轉換爲16進制格式:
printf "%x\n" tid
第五步:最後打印線程的堆棧信息:
jstack pid |grep tid -A 60
找到出現問題的代碼了!
現在來分析下具體的代碼:ShortSocketIO.readBytes(ShortSocketIO.java:106)
ShortSocketIO是應用封裝的一個用短連接Socket通信的工具類。readBytes函數的代碼如下:
public byte[] readBytes(int length) throws IOException {
if ((this.socket == null) || (!this.socket.isConnected())) {
throw new IOException("++++ attempting to read from closed socket");
}
byte[] result = null;
ByteArrayOutputStream bos = new ByteArrayOutputStream();
if (this.recIndex >= length) {
bos.write(this.recBuf, 0, length);
byte[] newBuf = new byte[this.recBufSize];
if (this.recIndex > length) {
System.arraycopy(this.recBuf, length, newBuf, 0, this.recIndex - length);
}
this.recBuf = newBuf;
this.recIndex -= length;
} else {
int totalread = length;
if (this.recIndex > 0) {
totalread -= this.recIndex;
bos.write(this.recBuf, 0, this.recIndex);
this.recBuf = new byte[this.recBufSize];
this.recIndex = 0;
}
int readCount = 0;
while (totalread > 0) {
if ((readCount = this.in.read(this.recBuf)) > 0) {
if (totalread > readCount) {
bos.write(this.recBuf, 0, readCount);
this.recBuf = new byte[this.recBufSize];
this.recIndex = 0;
} else {
bos.write(this.recBuf, 0, totalread);
byte[] newBuf = new byte[this.recBufSize];
System.arraycopy(this.recBuf, totalread, newBuf, 0, readCount - totalread);
this.recBuf = newBuf;
this.recIndex = (readCount - totalread);
}
totalread -= readCount;
}
}
}
問題就出在標紅的代碼部分。如果this.in.read()返回的數據小於等於0時,循環就一直進行下去了。而這種情況在網絡擁塞的時候是可能發生的。
至於具體怎麼修改就看業務邏輯應該怎麼對待這種特殊情況了。
最後,總結下排查CPU故障的方法和技巧有哪些:
1、top命令:Linux命令。可以查看實時的CPU使用情況。也可以查看最近一段時間的CPU使用情況。
2、PS命令:Linux命令。強大的進程狀態監控命令。可以查看進程以及進程中線程的當前CPU使用情況。屬於當前狀態的採樣數據。
3、jstack:Java提供的命令。可以查看某個進程的當前線程棧運行情況。根據這個命令的輸出可以定位某個進程的所有線程的當前運行狀態、運行代碼,以及是否死鎖等等。
4、pstack:Linux命令。可以查看某個進程的當前線程棧運行情況。