一圖勝萬言。在測試性能的時候,尤其如此。對於我們常常用到的fio 測試的結果,怎麼樣能快速生成圖表?
確保FIO命令能夠記錄性能數據
參考下面的命令:
fio -filename=/dev/nvme2n1 -thread -numjobs=1 -iodepth=64 --bs=4K -direct=1 --rw=write -ioengine=libaio --group_reporting -name=perf --output-format=normal --log_avg_msec=10000 --write_bw_log=1M-write.results --write_iops_log=1M-write.results --write_lat_log=1M-write.results --runtime=21 --time_based上面的命令執行完之後,大概會生成如下的幾個性能數據文件:
[root@szw] nvme_ssd_performance_test]# ls -alrt
total 40
drwxr-xr-x 6 root root 4096 Jan 21 07:57 ..
-rw-r--r-- 1 root root  305 Jan 21 08:20 draw_result.py
-rw------- 1 root root 2999 Jan 21 14:20 nohup.out
-rw-r--r-- 1 root root  650 Jan 21 15:39 run-fio.sh
drwxr-xr-x 2 root root 4096 Jan 21 15:39 .
-rw-r--r-- 1 root root  171 Jan 21 15:40 1M-write.results_slat.1.log
-rw-r--r-- 1 root root  203 Jan 21 15:40 1M-write.results_lat.1.log
-rw-r--r-- 1 root root  203 Jan 21 15:40 1M-write.results_clat.1.log
-rw-r--r-- 1 root root  171 Jan 21 15:40 1M-write.results_iops.1.log
-rw-r--r-- 1 root root  171 Jan 21 15:40 1M-write.results_bw.1.log
準備繪圖環境
在mac 環境
sudo python -mpip install matplotlib
安裝完後,你可以使用 python -m pip list 命令來查看是否安裝了 matplotlib 模塊。
在Linux環境
Debian / Ubuntu:
sudo apt-get install python-matplotlib
Fedora / Redhat:
sudo yum install python-matplotlib
導出性能數據、製作圖表
參考下面的命令,可以繪圖:
chao@B00000B:~$cat draw.py
#!/usr/bin/python
# coding: utf-8
import matplotlib.pyplot as plt
import numpy as np
import matplotlib as mpl
mpl.rcParams['font.family'] = 'sans-serif'
mpl.rcParams['font.sans-serif'] = 'NSimSun,Times New Roman'
a = np.loadtxt('./bw.txt', delimiter=',')
print(a)
x,y,z,v = np.loadtxt('./bw.txt', delimiter=',', unpack=True)
#x, y, z = np.loadtxt('./bw.txt', delimiter=',')
plt.plot(x, y, '*', label='Data', color='black')
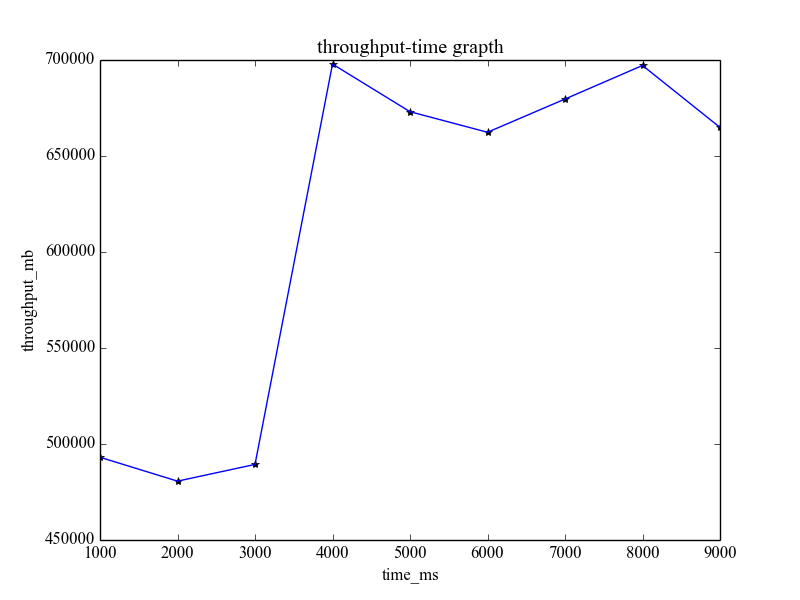
plt.xlabel('time_ms')
plt.ylabel('throughput_mb')
plt.title('throughput-time grapth')
plt.plot(x,y)
#plt.show()
#plt.legend()
plt.show()實際效果如下: