1.解壓到本地

2.創建測試文件(接收控制檯數據輸出給控制檯)
vim local.yml
filebeat.inputs:
#接收數據,捕獲數據
- type: stdin
#類型爲,標準輸入,就是控制檯輸入
  enabled: true
setup.template.settings:
  index.number_of_shards: 3
output.console:
#輸出數據,到控制檯
  pretty: true
  enable: true
./filebeat -e -c local.yml #啓動filebeat
holle
#鍵入 "holle"
輸出結果
{
  "@timestamp": "2020-03-26T08:44:32.621Z",
  "@metadata": {
    "beat": "filebeat",
    "type": "_doc",
    "version": "7.0.0"
  },
  "input": {
    "type": "stdin"
  },
  "agent": {
    "type": "filebeat",
    "ephemeral_id": "5c55d697-d706-4f10-9ba4-294e2faf741e",
    "hostname": "cs25",
    "id": "d11ef6a4-735c-4077-976f-3de48d442ef5",
    "version": "7.0.0"
  },
  "ecs": {
    "version": "1.0.0"
  },
  "host": {
    "name": "cs25"
  },
  "message": "holle",
  "log": {
    "offset": 0,
    "file": {
      "path": ""
    }
  }
}
#看見反饋能看到 "holle" 被捕獲到了
3.測試讀取文件(捕獲文件輸出到控制檯)
vim flie.yml
filebeat.inputs:
- type: log
  enabled: true
  paths:
  - /root/*.log
#捕獲數據的路徑,*表示該目錄下的所有log文件
setup.template.settings:
  index.number_of_shards: 3
output.console:
  pretty: true
  enable: true
./filebeat -e -c file.yml #以file.yml 配置文件啓動 fliebeat

#再啓動一個xshell 連接 'echo "哈哈哈" > /root/123.log' 輸入幾個字符到 123.log
輸出結果
{
  "@timestamp": "2020-03-26T08:52:36.664Z",
  "@metadata": {
    "beat": "filebeat",
    "type": "_doc",
    "version": "7.0.0"
  },
  "agent": {
    "type": "filebeat",
    "ephemeral_id": "d58a676c-13de-4f7c-a1d7-0974d89e06d9",
    "hostname": "cs25",
    "id": "d11ef6a4-735c-4077-976f-3de48d442ef5",
    "version": "7.0.0"
  },
  "ecs": {
    "version": "1.0.0"
  },
  "log": {
    "offset": 0,
    "file": {
      "path": "/root/123.log"
    }
  },
  "message": "哈哈哈",
  "input": {
    "type": "log"
  },
  "host": {
    "name": "cs25"
  }
}
#看結果反饋,我們輸入到文件裏的信息,被filebeat 捕獲了。
4.自定義字段,tag
vim file_zdy.yml #修改之前的配置文件
filebeat.inputs:
- type: log
  enabled: true
  paths:
  - /root/*.log
  tags: ["web"]
  #添加自定義tag,便於後續的處理
  fields:
    from: cs
    #添加自定義字段
setup.template.settings:
  index.number_of_shards: 3
output.console:
  pretty: true
  enable: true
再次啓動一個xshell 輸入數據到"/root/123.log"文件
輸出結果
{
  "@timestamp": "2020-03-26T09:01:08.561Z",
  "@metadata": {
    "beat": "filebeat",
    "type": "_doc",
    "version": "7.0.0"
  },
  "message": "666",
  "tags": [
    "web"
  ],
  "input": {
    "type": "log"
  },
  "fields": {
    "from": "cs"
  },
  "ecs": {
    "version": "1.0.0"
  },
  "host": {
    "name": "cs25"
  },
  "agent": {
    "ephemeral_id": "5615f0e9-2000-486d-a918-6288d0d431ee",
    "hostname": "cs25",
    "id": "d11ef6a4-735c-4077-976f-3de48d442ef5",
    "version": "7.0.0",
    "type": "filebeat"
  },
  "log": {
    "offset": 0,
    "file": {
      "path": "/root/123.log"
    }
  }
}
#看結果反饋,tag和字段都加上去了
5.輸出到Elasticsearch
vim file_el.yml #修改配置文件
filebeat.inputs:
- type: log
  enabled: true
  paths:
  - /root/*.log
  tags: ["web"]
  fields:
    from: cs
setup.template.settings:
  index.number_of_shards: 3
  #指定索引的分片數
output.elasticsearch:
  #指定輸出到elasticsearch,下面hosts是elasticsearch的服務監聽地址
  hosts: ["192.168.0.25:9200","192.168.0.27:9200","192.168.0.69:9200"]
./filebeat -e -c file_el.yml #啓動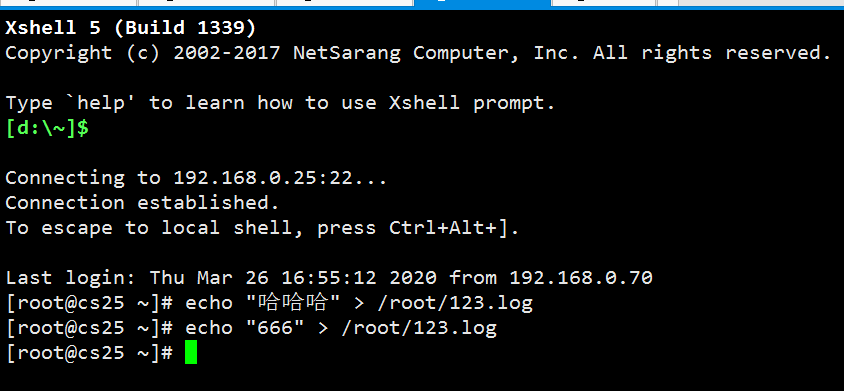
#在另一個xshell 裏輸入數據到日誌裏

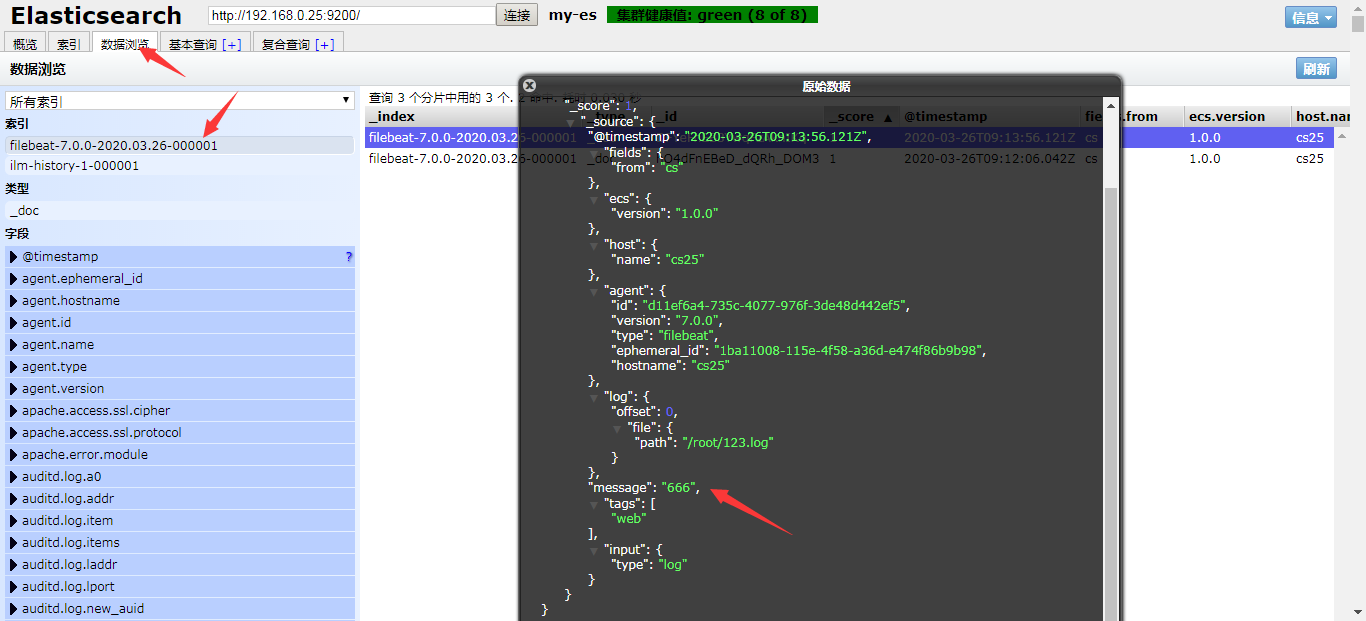
#登錄到elasticsearch 上,能看到新創建了一個索引,查看數據也能看到剛剛輸入的數據。
Filebeat由兩個主要組件組成:prospector 和 harvester。harvester:
負責讀取單個文件的內容。
如果文件在讀取時被刪除或重命名,Filebeat將繼續讀取文件。prospector
prospector 負責管理harvester並找到所有要讀取的文件來源。
如果輸入類型爲日誌,則查找器將查找路徑匹配的所有文件,併爲每個文件啓動一個harvester。
Filebeat目前支持兩種prospector類型:log和stdin。
Filebeat如何保持文件的狀態
Filebeat 保存每個文件的狀態並經常將狀態刷新到磁盤上的註冊文件中。
該狀態用於記住harvester正在讀取的最後偏移量,並確保發送所有日誌行。
如果輸出(例如Elasticsearch或Logstash)無法訪問,Filebeat會跟蹤最後發送的行,並在輸出再次可用時繼續讀取文件。
在Filebeat運行時,每個prospector內存中也會保存的文件狀態信息,當重新啓動Filebeat時,將使用註冊文件的數據來重建文件狀態,Filebeat將每個harvester在從保存的最後偏移量繼續讀取。文件狀態記錄在data/registry文件中。
#參數說明
-e: 輸出到標準輸出,默認輸出到syslog和logs下
-c: 指定配置文件
-d: 輸出debug信息
6.收集httpd 的日誌
vim file_httpd.yml #編輯httpd的filebeat的配置文件
filebeat.inputs:
- type: log
  enabled: true
  paths:
  - /var/log/httpd/error_log
  tags: ["httpd_access"]
#收集訪問日誌
- type: log
  enabled: true
  paths:
  - /var/log/httpd/access_log
  tags: ["httpd_error"]
    #收集錯誤日誌
setup.template.settings:
  index.number_of_shards: 3
  #指定索引的分片數
output.elasticsearch:
  #指定輸出到elasticsearch,下面hosts是elasticsearch的服務監聽地址
  hosts: ["192.168.0.25:9200","192.168.0.27:9200","192.168.0.69:9200"]

可以看到,在message中已經獲取到了httpd的日誌,但是,內容並沒有經過處理,只是讀取到原數據,那麼對於我們後期的操作是不利的,有辦法解決嗎?
7.filebeat——Module
前面要想實現日誌數據的讀取以及處理都是自己手動配置的,其實,在Filebeat中,有大量的Module,可以簡化我們的配置,直接就可以使用,如下:
./filebeat modules enable apache #開啓httpd 的mod
./filebeat modules list #查看已開啓的modules
vim ${path.config}/modules.d/apache.yml #修改httpd modules
#加入httpd 的日誌路徑
vim file_httpd.yml #修改httpd的fliebeat配置文件
filebeat.inputs:
#- type: log
#  enabled: true
#  paths:
#  - /var/log/httpd/access_log
#  tags: ["httpd_access"]

#- type: log
#  enabled: true
#  paths:
#  - /var/log/httpd/error_log
#  tags: ["httpd_error"]
#輸入不需要了,由下面的modules 輸入
setup.template.settings:
  index.number_of_shards: 3
  #指定索引的分片數
output.elasticsearch:
  #指定輸出到elasticsearch,下面hosts是elasticsearch的服務監聽地址
  hosts: ["192.168.0.25:9200","192.168.0.27:9200","192.168.0.69:9200"]
filebeat.config.modules:
  path: modules.d/*.yml
  #讀取這個路徑的所有 modules的配置文件,由於只有httpd軟件開啓了mod,所有隻有httpd的生效
  reload.enabled: false

#看結果,拿到的日誌被分割了,看起來更舒服了
8.Metricbeat
Metricbeat有2部分組成,一部分是Module,另一部分爲Metricset。
Module
收集的對象,如:mysql、redis、nginx、操作系統等;
Metricset
收集指標的集合,如:cpu、memory、network等;
部署與收集系統指標
vim metricbeat.yml #修改默認的配置文件
metricbeat.config.modules:
  path: ${path.config}/modules.d/*.yml
  reload.enabled: false
setup.template.settings:
  index.number_of_shards: 1
  index.codec: best_compression
setup.kibana:
output.elasticsearch:
  hosts: ["192.168.0.25:9200","192.168.0.27:9200","192.168.0.69:9200"]
processors:
  - add_host_metadata: ~
  - add_cloud_metadata: ~
./metricbeat -e #啓動即可
#到elasticsearch上查看,多了很多的系統信息
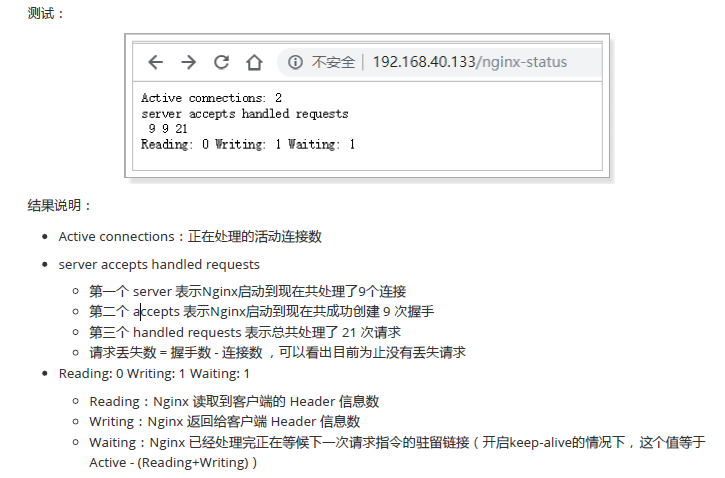
9.收集nginx 狀態
vim /etc/nginx/nginx.conf #配置nginx選項,開啓nginx狀態信息,注意這個需要"--
with-http_stub_status_module" 模塊
location /nginx-status {
       stub_status on;
       access_log off;
}
#最加一個location,開啓nginx狀態信息
./metricbeat modules enable nginx #開啓nginx 的modules
vim modules.d/nginx.yml #修改nginx 的 metricbeat的modules 配置文件
- module: nginx
  period: 10s
  hosts: ["http://192.168.0.25"]
  server_status_path: "nginx-status"
./metricbeat modules disable system #關閉收集系統的modules
./metricbeat -e #開啓
#如圖,nginx的指標數據已經被收集了