


GRE網絡中的路由協議部署方案
考慮點:
第一:兩個站點設備上面用哪個接口建立OSPF鄰居關係呢?
第二:OSPF的hello報文是組播傳遞 224.0.0.5 這個組播地址不能跨跳 即TTL爲1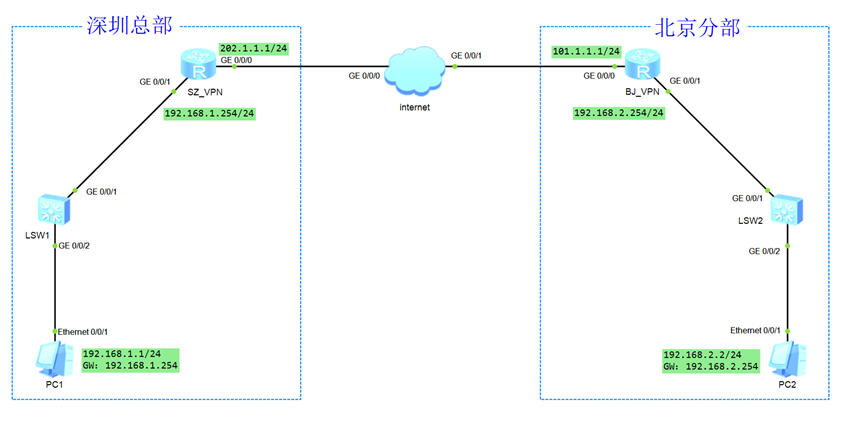
思路:
直接用tunnel接口之間建立OSPF關係
在SZ_***的G0/0/0接口抓包所示: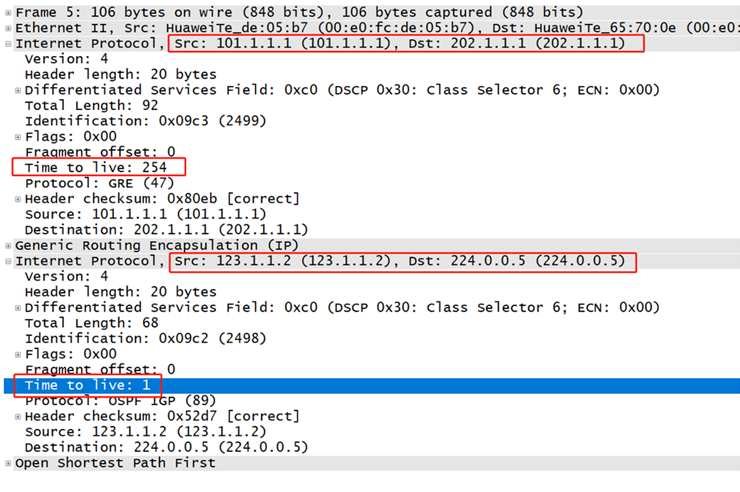
第一步:刪除SZ***和BJ***設備的靜態引流路由
**SZ_*的配置
#
undo ip route-static 192.168.2.0 255.255.255.0 Tunnel0/0/1
#**BJ_*的配置
#
undo ip route-static 192.168.1.0 255.255.255.0 Tunnel0/0/1
#第二步:在SZ***和BJ***設備上配置OSPF動態引流路由
**SZ_*的配置
#
ospf 1 router-id 1.1.1.1
 area 0.0.0.0
  network 123.1.1.1 0.0.0.0
  network 192.168.1.0 0.0.0.255
#**BJ_*的配置
#
ospf 1 router-id 2.2.2.2
 area 0.0.0.0
  network 123.1.1.2 0.0.0.0
  network 192.168.2.0 0.0.0.255
#
第三步:檢查如下
**SZ_*設備的檢查
<SZ_***>display ip routing-table protocol ospf
Route Flags: R - relay, D - download to fib
------------------------------------------------------------------------------
Public routing table : OSPF
         Destinations : 1        Routes : 1

OSPF routing table status : <Active>
         Destinations : 1        Routes : 1

Destination/Mask    Proto   Pre  Cost      Flags NextHop         Interface

    192.168.2.0/24  OSPF    10   1563        D   123.1.1.2       Tunnel0/0/1

OSPF routing table status : <Inactive>
Destinations : 0 Routes : 0**BJ_*設備的檢查
[BJ_***]display ip routing-table protocol ospf
Route Flags: R - relay, D - download to fib
------------------------------------------------------------------------------
Public routing table : OSPF
         Destinations : 1        Routes : 1

OSPF routing table status : <Active>
         Destinations : 1        Routes : 1

Destination/Mask    Proto   Pre  Cost      Flags NextHop         Interface

    192.168.1.0/24  OSPF    10   1563        D   123.1.1.1       Tunnel0/0/1

OSPF routing table status : <Inactive>
         Destinations : 0        Routes : 0
<SZ_***>display ospf interface Tunnel0/0/1
OSPF Process 1 with Router ID 1.1.1.1
Interfaces
Interface: 123.1.1.1 (Tunnel0/0/1) --> 123.1.1.2
Cost: 1562 State: P-2-P Type: P2P MTU: 1500
Timers: Hello 10 , Dead 40 , Poll 120 , Retransmit 5 , Transmit Delay 1PC1可以訪問到PC2
PC>ping  192.168.2.2

Ping 192.168.2.2: 32 data bytes, Press Ctrl_C to break
Request timeout!
From 192.168.2.2: bytes=32 seq=2 ttl=126 time=94 ms
From 192.168.2.2: bytes=32 seq=3 ttl=126 time=94 ms
From 192.168.2.2: bytes=32 seq=4 ttl=126 time=78 ms
From 192.168.2.2: bytes=32 seq=5 ttl=126 time=156 ms

--- 192.168.2.2 ping statistics ---
  5 packet(s) transmitted
  4 packet(s) received
  20.00% packet loss
  round-trip min/avg/max = 0/105/156 ms
PC1追蹤PC2
PC>tracert 192.168.2.2

traceroute to 192.168.2.2, 8 hops max
(ICMP), press Ctrl+C to stop
 1  192.168.1.254   31 ms  47 ms  47 ms
 2  123.1.1.2   62 ms  47 ms  47 ms
 3  192.168.2.2   78 ms  94 ms  62 ms

PC>**在BJ_*設備上面宣告101.1.1.1路由到OSPF進程當中
#
ospf 1 router-id 2.2.2.2
 area 0.0.0.0
  network 101.1.1.1 0.0.0.0
  network 123.1.1.2 0.0.0.0
  network 192.168.2.0 0.0.0.255
#SZ***和BJ*設備裏面的OSPF鄰居狀態機會出現down和full的現象出現
思考請問爲什麼會出現這種現象?*
1、SZ_會學到101.1.1.1的OSPF路由 當SZ***往外發送hello報文的時候 會進行GRE的封裝 而GRE的封裝的DIP地址是101.1.1.1的IP地址 而由於SZ到達101.1.1.1的下一跳是tunnel0/0/1接口 是我自己本身 無法發送出去 那等待dead時間到期後 SZ_和BJ***的OSPF狀態機會down
2、down了之後 SZ就沒有101.1.1.1的路由 SZ_會10s往外發送hello報文 關係就會建立起來FULL
PC>ping  192.168.2.2 -t

Ping 192.168.2.2: 32 data bytes, Press Ctrl_C to break
Request timeout!
Request timeout!
Request timeout!
Request timeout!
Request timeout!
Request timeout!
Request timeout!
Request timeout!
Request timeout!
Request timeout!
Request timeout!
Request timeout!
Request timeout!
Request timeout!
Request timeout!
Request timeout!
GRE多站點之間的組網
思路:在總部建立兩個tunnel接口 分別爲tunnel0/0/1和tunnel0/0/2接口 用這兩個tunnel接口分別和北京和廣州部分進行互聯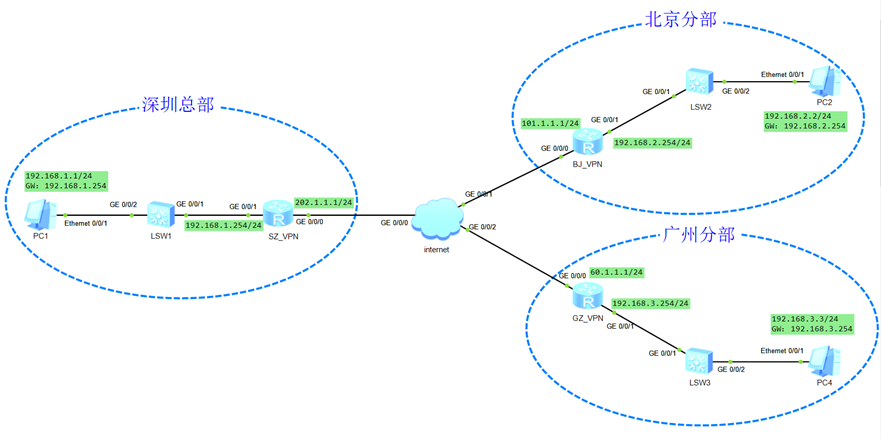
第一步:基本配置
**SZ_*路由器的配置
#
 sysname SZ_***
#
interface GigabitEthernet0/0/0
 ip address 202.1.1.1 255.255.255.0
#
interface GigabitEthernet0/0/1
 ip address 192.168.1.254 255.255.255.0
#
ip route-static 0.0.0.0 0.0.0.0 202.1.1.254
#**BJ_*路由器的配置
#
 sysname BJ_***
#
interface GigabitEthernet0/0/0
 ip address 101.1.1.1 255.255.255.0
#
interface GigabitEthernet0/0/1
 ip address 192.168.2.254 255.255.255.0
#
ip route-static 0.0.0.0 0.0.0.0 101.1.1.254
#**GZ_*路由器的配置
#
 sysname GZ_***
#
interface GigabitEthernet0/0/0
 ip address 60.1.1.1 255.255.255.0
#
interface GigabitEthernet0/0/1
 ip address 192.168.3.254 255.255.255.0
#
ip route-static 0.0.0.0 0.0.0.0 60.1.1.254
#
internet的配置
#
interface GigabitEthernet0/0/0
 ip address 202.1.1.254 255.255.255.0
#
interface GigabitEthernet0/0/1
 ip address 101.1.1.254 255.255.255.0
#
interface GigabitEthernet0/0/2
 ip address 60.1.1.254 255.255.255.0
#
檢查如下:
**檢查SZ_*和PC1的通信
<SZ_***>ping 192.168.1.1
  PING 192.168.1.1: 56  data bytes, press CTRL_C to break
    Reply from 192.168.1.1: bytes=56 Sequence=1 ttl=128 time=40 ms
    Reply from 192.168.1.1: bytes=56 Sequence=2 ttl=128 time=60 ms
    Reply from 192.168.1.1: bytes=56 Sequence=3 ttl=128 time=40 ms
    Reply from 192.168.1.1: bytes=56 Sequence=4 ttl=128 time=60 ms
    Reply from 192.168.1.1: bytes=56 Sequence=5 ttl=128 time=50 ms

  --- 192.168.1.1 ping statistics ---
    5 packet(s) transmitted
    5 packet(s) received
    0.00% packet loss
round-trip min/avg/max = 40/50/60 ms**檢查BJ_*和PC2的通信
<SZ_***>ping 192.168.2.2
  PING 192.168.1.1: 56  data bytes, press CTRL_C to break
    Reply from 192.168.2.2: bytes=56 Sequence=1 ttl=128 time=40 ms
    Reply from 192.168.2.2: bytes=56 Sequence=2 ttl=128 time=60 ms
    Reply from 192.168.2.2: bytes=56 Sequence=3 ttl=128 time=40 ms
    Reply from 192.168.2.2: bytes=56 Sequence=4 ttl=128 time=60 ms
    Reply from 192.168.2.2: bytes=56 Sequence=5 ttl=128 time=50 ms

  --- 192.168.2.2 ping statistics ---
    5 packet(s) transmitted
    5 packet(s) received
    0.00% packet loss
round-trip min/avg/max = 40/50/60 ms**檢查GZ_*和PC3的通信
<SZ_***>ping 192.168.3.3
  PING 192.168.1.1: 56  data bytes, press CTRL_C to break
    Reply from 192.168.3.3: bytes=56 Sequence=1 ttl=128 time=40 ms
    Reply from 192.168.3.3: bytes=56 Sequence=2 ttl=128 time=60 ms
    Reply from 192.168.3.3: bytes=56 Sequence=3 ttl=128 time=40 ms
    Reply from 192.168.3.3: bytes=56 Sequence=4 ttl=128 time=60 ms
    Reply from 192.168.3.3: bytes=56 Sequence=5 ttl=128 time=50 ms

  --- 192.168.3.3 ping statistics ---
    5 packet(s) transmitted
    5 packet(s) received
    0.00% packet loss
round-trip min/avg/max = 40/50/60 ms檢查SZ***和BJ*的通信**
<SZ_***>ping 101.1.1.1
  PING 101.1.1.1: 56  data bytes, press CTRL_C to break
    Reply from 101.1.1.1: bytes=56 Sequence=1 ttl=254 time=30 ms
    Reply from 101.1.1.1: bytes=56 Sequence=2 ttl=254 time=20 ms
    Reply from 101.1.1.1: bytes=56 Sequence=3 ttl=254 time=40 ms
    Reply from 101.1.1.1: bytes=56 Sequence=4 ttl=254 time=20 ms
    Reply from 101.1.1.1: bytes=56 Sequence=5 ttl=254 time=30 ms

  --- 101.1.1.1 ping statistics ---
    5 packet(s) transmitted
    5 packet(s) received
    0.00% packet loss
round-trip min/avg/max = 20/28/40 ms檢查SZ***GZ*的通信**
<SZ_***>ping 60.1.1.1
  PING 60.1.1.1: 56  data bytes, press CTRL_C to break
    Reply from 60.1.1.1: bytes=56 Sequence=1 ttl=254 time=30 ms
    Reply from 60.1.1.1: bytes=56 Sequence=2 ttl=254 time=30 ms
    Reply from 60.1.1.1: bytes=56 Sequence=3 ttl=254 time=20 ms
    Reply from 60.1.1.1: bytes=56 Sequence=4 ttl=254 time=20 ms
    Reply from 60.1.1.1: bytes=56 Sequence=5 ttl=254 time=30 ms

  --- 60.1.1.1 ping statistics ---
    5 packet(s) transmitted
    5 packet(s) received
    0.00% packet loss
round-trip min/avg/max = 20/26/30 ms檢查BJ***和GZ*的通信**
<BJ_***>ping 60.1.1.1
  PING 60.1.1.1: 56  data bytes, press CTRL_C to break
    Reply from 60.1.1.1: bytes=56 Sequence=1 ttl=254 time=20 ms
    Reply from 60.1.1.1: bytes=56 Sequence=2 ttl=254 time=20 ms
    Reply from 60.1.1.1: bytes=56 Sequence=3 ttl=254 time=10 ms
    Reply from 60.1.1.1: bytes=56 Sequence=4 ttl=254 time=30 ms
    Reply from 60.1.1.1: bytes=56 Sequence=5 ttl=254 time=30 ms

  --- 60.1.1.1 ping statistics ---
    5 packet(s) transmitted
    5 packet(s) received
    0.00% packet loss
    round-trip min/avg/max = 10/22/30 ms
檢查PC1和PC2的通信
PC>ping  192.168.2.2

Ping 192.168.2.2: 32 data bytes, Press Ctrl_C to break
Request timeout!
Request timeout!
Request timeout!
Request timeout!
Request timeout!

--- 192.168.2.2 ping statistics ---
  5 packet(s) transmitted
  0 packet(s) received
  100.00% packet loss
檢查PC1和PC3的通信
PC>ping  192.168.3.3

Ping 192.168.3.3: 32 data bytes, Press Ctrl_C to break
Request timeout!
Request timeout!
Request timeout!
Request timeout!
Request timeout!

--- 192.168.3.3 ping statistics ---
  5 packet(s) transmitted
  0 packet(s) received
  100.00% packet loss
檢查PC2和PC3的通信
PC>ping 192.168.3.3

Ping 192.168.3.3: 32 data bytes, Press Ctrl_C to break
Request timeout!
Request timeout!
Request timeout!
Request timeout!
Request timeout!

--- 192.168.3.3 ping statistics ---
  5 packet(s) transmitted
  0 packet(s) received
100.00% packet loss第二步:分別在SZ***和BJ***啓動TUNNEL接口
**SZ_*的配置
#
interface Tunnel0/0/1
 ip address 123.1.1.1 255.255.255.0
 tunnel-protocol gre
 source 202.1.1.1
 destination 101.1.1.1
#
interface Tunnel0/0/2
 ip address 124.1.1.1 255.255.255.0
 tunnel-protocol gre
 source 202.1.1.1
 destination 60.1.1.1
#**BJ_*的配置
#
interface Tunnel0/0/1
 ip address 123.1.1.2 255.255.255.0
 tunnel-protocol gre
 source 101.1.1.1
 destination 202.1.1.1
#**GZ_*的配置
#
interface Tunnel0/0/1
 ip address 124.1.1.3 255.255.255.0
 tunnel-protocol gre
 source 60.1.1.1
 destination 202.1.1.1
#
第三步:配置引流路由
**SZ_*的配置
#
ip route-static 192.168.2.0 255.255.255.0 Tunnel0/0/1
ip route-static 192.168.3.0 255.255.255.0 Tunnel0/0/2
#**BJ_*的配置
#
ip route-static 192.168.1.0 255.255.255.0 Tunnel0/0/1
#**GZ_*的配置
#
ip route-static 192.168.1.0 255.255.255.0 Tunnel0/0/1
#
第四步:檢查GRE隧道是否成功
**SZ_*的檢查
<SZ_***>display interface Tunnel 0/0/1
Tunnel0/0/1 current state : UP
Line protocol current state : UP
Last line protocol up time : 2020-02-25 17:50:10 UTC-08:00
Description:HUAWEI, AR Series, Tunnel0/0/1 Interface
Route Port,The Maximum Transmit Unit is 1500
Internet Address is 123.1.1.1/24
Encapsulation is TUNNEL, loopback not set
Tunnel source 202.1.1.1 (GigabitEthernet0/0/0), destination 101.1.1.1
Tunnel protocol/transport GRE/IP, key disabled
keepalive disabled
Checksumming of packets disabled
Current system time: 2020-02-25 20:19:16-08:00
    300 seconds input rate 0 bits/sec, 0 packets/sec
    300 seconds output rate 0 bits/sec, 0 packets/sec
    0 seconds input rate 0 bits/sec, 0 packets/sec
    0 seconds output rate 0 bits/sec, 0 packets/sec
    0 packets input,  0 bytes
    0 input error
    0 packets output,  0 bytes
    0 output error
    Input bandwidth utilization  : --
    Output bandwidth utilization : --

<SZ_***>
第二個tunnel接口的詳細信息
<SZ_***>display interface Tunnel 0/0/2
Tunnel0/0/2 current state : UP
Line protocol current state : UP
Last line protocol up time : 2020-02-25 23:10:15 UTC-08:00
Description:HUAWEI, AR Series, Tunnel0/0/2 Interface
Route Port,The Maximum Transmit Unit is 1500
Internet Address is 124.1.1.1/24
Encapsulation is TUNNEL, loopback not set
Tunnel source 202.1.1.1 (GigabitEthernet0/0/0), destination 60.1.1.1
Tunnel protocol/transport GRE/IP, key disabled
keepalive disabled
Checksumming of packets disabled
Current system time: 2020-02-25 23:29:12-08:00
    300 seconds input rate 0 bits/sec, 0 packets/sec
    300 seconds output rate 0 bits/sec, 0 packets/sec
    0 seconds input rate 0 bits/sec, 0 packets/sec
    0 seconds output rate 0 bits/sec, 0 packets/sec
    0 packets input,  0 bytes
    0 input error
    0 packets output,  0 bytes
    0 output error
    Input bandwidth utilization  : --
Output bandwidth utilization : --**BJ_*的檢查
<BJ_***>display interface Tunnel 0/0/1
Tunnel0/0/1 current state : UP
Line protocol current state : UP
Last line protocol up time : 2020-02-25 17:50:53 UTC-08:00
Description:HUAWEI, AR Series, Tunnel0/0/1 Interface
Route Port,The Maximum Transmit Unit is 1500
Internet Address is 123.1.1.2/24
Encapsulation is TUNNEL, loopback not set
Tunnel source 101.1.1.1 (GigabitEthernet0/0/0), destination 202.1.1.1
Tunnel protocol/transport GRE/IP, key disabled
keepalive disabled
Checksumming of packets disabled
Current system time: 2020-02-25 20:21:08-08:00
    300 seconds input rate 0 bits/sec, 0 packets/sec
    300 seconds output rate 0 bits/sec, 0 packets/sec
    0 seconds input rate 0 bits/sec, 0 packets/sec
    0 seconds output rate 0 bits/sec, 0 packets/sec
    0 packets input,  0 bytes
    0 input error
    0 packets output,  0 bytes
    0 output error
    Input bandwidth utilization  : --
    Output bandwidth utilization : --

<BJ_***>**GZ_*的檢查
<ZG_***>display interface Tunnel 0/0/1
Tunnel0/0/1 current state : UP
Line protocol current state : UP
Last line protocol up time : 2020-02-25 23:03:02 UTC-08:00
Description:HUAWEI, AR Series, Tunnel0/0/1 Interface
Route Port,The Maximum Transmit Unit is 1500
Internet Address is 124.1.1.3/24
Encapsulation is TUNNEL, loopback not set
Tunnel source 60.1.1.1 (GigabitEthernet0/0/0), destination 202.1.1.1
Tunnel protocol/transport GRE/IP, key disabled
keepalive disabled
Checksumming of packets disabled
Current system time: 2020-02-25 23:30:27-08:00
    300 seconds input rate 0 bits/sec, 0 packets/sec
    300 seconds output rate 0 bits/sec, 0 packets/sec
    0 seconds input rate 0 bits/sec, 0 packets/sec
    0 seconds output rate 0 bits/sec, 0 packets/sec
    0 packets input,  0 bytes
    0 input error
    0 packets output,  0 bytes
    0 output error
    Input bandwidth utilization  : --
    Output bandwidth utilization : --

<ZG_***>
第五步:實現北京和廣州分部互通
**BJ_*的配置
#
ip route-static 192.168.3.0 255.255.255.0 Tunnel0/0/1
#**GZ_*的配置
#
ip route-static 192.168.3.0 255.255.255.0 Tunnel0/0/1
#
測試PC2和PC3的連通性
PC>ping 192.168.3.3

Ping 192.168.3.3: 32 data bytes, Press Ctrl_C to break
Request timeout!
From 192.168.3.3: bytes=32 seq=2 ttl=125 time=78 ms
From 192.168.3.3: bytes=32 seq=3 ttl=125 time=109 ms
From 192.168.3.3: bytes=32 seq=4 ttl=125 time=94 ms
From 192.168.3.3: bytes=32 seq=5 ttl=125 time=78 ms

--- 192.168.3.3 ping statistics ---
  5 packet(s) transmitted
  4 packet(s) received
  20.00% packet loss
  round-trip min/avg/max = 0/89/109 ms

PC>第六步:在BJ-和GZ-起一個TUNNEL接口
刪除如下引流路由
在BJ_***刪除
ip route-static 192.168.3.0 255.255.255.0 Tunnel0/0/1在GZ_***刪除
ip route-static 192.168.2.0 255.255.255.0 Tunnel0/0/1在BJ***和GZ創建tunnel0/0/2接口
在BJ_創建
#
interface Tunnel0/0/2
 ip address 125.1.1.2 255.255.255.0
 tunnel-protocol gre
 source 101.1.1.1
 destination 60.1.1.1
#
ip route-static 192.168.3.0 255.255.255.0 Tunnel0/0/2
在GZ_***創建
#
interface Tunnel0/0/2
 ip address 125.1.1.3 255.255.255.0
 tunnel-protocol gre
 source 60.1.1.1
 destination 101.1.1.1
#
ip route-static 192.168.2.0 255.255.255.0 Tunnel0/0/2
檢查如下
[BJ_***]display interface Tunnel 0/0/2
Tunnel0/0/2 current state : UP
Line protocol current state : UP
Last line protocol up time : 2020-02-26 00:40:33 UTC-08:00
Description:HUAWEI, AR Series, Tunnel0/0/2 Interface
Route Port,The Maximum Transmit Unit is 1500
Internet Address is 125.1.1.2/24
Encapsulation is TUNNEL, loopback not set
Tunnel source 101.1.1.1 (GigabitEthernet0/0/0), destination 60.1.1.1
Tunnel protocol/transport GRE/IP, key disabled
keepalive disabled
Checksumming of packets disabled
Current system time: 2020-02-26 00:53:56-08:00
    300 seconds input rate 0 bits/sec, 0 packets/sec
    300 seconds output rate 0 bits/sec, 0 packets/sec
    0 seconds input rate 0 bits/sec, 0 packets/sec
    0 seconds output rate 0 bits/sec, 0 packets/sec
    0 packets input,  0 bytes
    0 input error
    0 packets output,  0 bytes
    0 output error
    Input bandwidth utilization  : --
    Output bandwidth utilization : --

[BJ_***]
在PC2上面訪問PC3
PC>ping 192.168.3.3

Ping 192.168.3.3: 32 data bytes, Press Ctrl_C to break
From 192.168.3.3: bytes=32 seq=1 ttl=125 time=63 ms
From 192.168.3.3: bytes=32 seq=2 ttl=125 time=93 ms
From 192.168.3.3: bytes=32 seq=3 ttl=125 time=63 ms
From 192.168.3.3: bytes=32 seq=4 ttl=125 time=94 ms
From 192.168.3.3: bytes=32 seq=5 ttl=125 time=93 ms

--- 192.168.3.3 ping statistics ---
  5 packet(s) transmitted
  5 packet(s) received
  0.00% packet loss
  round-trip min/avg/max = 63/81/94 ms

PC>tracert 192.168.3.3

traceroute to 192.168.3.3, 8 hops max
(ICMP), press Ctrl+C to stop
 1  192.168.2.254   47 ms  46 ms  47 ms
 2  125.1.1.3   47 ms  63 ms  62 ms
 3  192.168.3.3   78 ms  94 ms  78 ms

PC>
GRE組網結合NAT講解
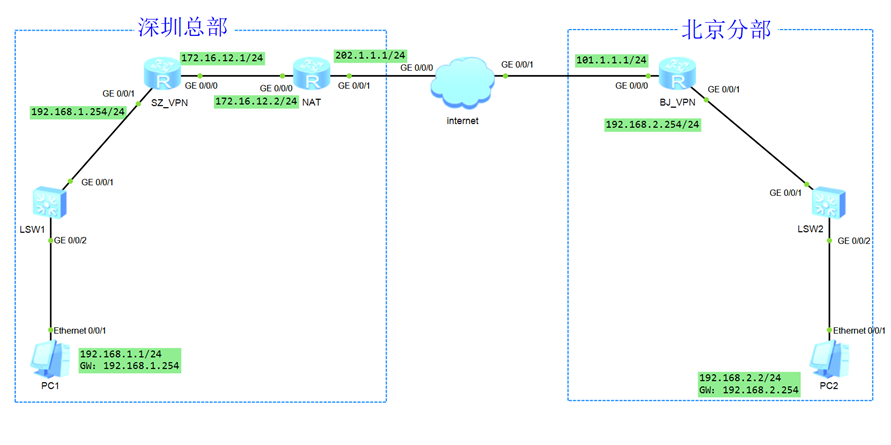
第一步:基本配置
**SZ_*路由器的配置
#
 sysname SZ_***
#
interface GigabitEthernet0/0/0
 ip address 172.16.12.1 255.255.255.0
#
interface GigabitEthernet0/0/1
 ip address 192.168.1.254 255.255.255.0
#
ip route-static 0.0.0.0 0.0.0.0 172.16.12.2
#**BJ_*路由器的配置
#
 sysname BJ_***
#
interface GigabitEthernet0/0/0
 ip address 101.1.1.1 255.255.255.0
#
interface GigabitEthernet0/0/1
 ip address 192.168.2.254 255.255.255.0
#
ip route-static 0.0.0.0 0.0.0.0 101.1.1.254
#
NAT路由器的配置
#
interface GigabitEthernet0/0/0
 ip address 172.16.12.2 255.255.255.0
#
interface GigabitEthernet0/0/1
 ip address 202.1.1.1 255.255.255.0
#
ip route-static 0.0.0.0 0.0.0.0 202.1.1.254
#
internet的配置
#
interface GigabitEthernet0/0/0
 ip address 202.1.1.254 255.255.255.0
#
interface GigabitEthernet0/0/1
 ip address 101.1.1.254 255.255.255.0
#
檢查如下:
**檢查SZ_*和PC1的通信
<SZ_***>ping 192.168.1.1
  PING 192.168.1.1: 56  data bytes, press CTRL_C to break
    Reply from 192.168.1.1: bytes=56 Sequence=1 ttl=128 time=40 ms
    Reply from 192.168.1.1: bytes=56 Sequence=2 ttl=128 time=60 ms
    Reply from 192.168.1.1: bytes=56 Sequence=3 ttl=128 time=40 ms
    Reply from 192.168.1.1: bytes=56 Sequence=4 ttl=128 time=60 ms
    Reply from 192.168.1.1: bytes=56 Sequence=5 ttl=128 time=50 ms

  --- 192.168.1.1 ping statistics ---
    5 packet(s) transmitted
    5 packet(s) received
    0.00% packet loss
round-trip min/avg/max = 40/50/60 ms**檢查BJ_*和PC2的通信
<SZ_***>ping 192.168.1.1
  PING 192.168.1.1: 56  data bytes, press CTRL_C to break
    Reply from 192.168.1.1: bytes=56 Sequence=1 ttl=128 time=40 ms
    Reply from 192.168.1.1: bytes=56 Sequence=2 ttl=128 time=60 ms
    Reply from 192.168.1.1: bytes=56 Sequence=3 ttl=128 time=40 ms
    Reply from 192.168.1.1: bytes=56 Sequence=4 ttl=128 time=60 ms
    Reply from 192.168.1.1: bytes=56 Sequence=5 ttl=128 time=50 ms

  --- 192.168.1.1 ping statistics ---
    5 packet(s) transmitted
    5 packet(s) received
    0.00% packet loss
round-trip min/avg/max = 40/50/60 ms**檢查NAT和BJ_*的通信
<SZ_***>ping 101.1.1.1
  PING 101.1.1.1: 56  data bytes, press CTRL_C to break
    Reply from 101.1.1.1: bytes=56 Sequence=1 ttl=254 time=30 ms
    Reply from 101.1.1.1: bytes=56 Sequence=2 ttl=254 time=20 ms
    Reply from 101.1.1.1: bytes=56 Sequence=3 ttl=254 time=40 ms
    Reply from 101.1.1.1: bytes=56 Sequence=4 ttl=254 time=20 ms
    Reply from 101.1.1.1: bytes=56 Sequence=5 ttl=254 time=30 ms

  --- 101.1.1.1 ping statistics ---
    5 packet(s) transmitted
    5 packet(s) received
    0.00% packet loss
    round-trip min/avg/max = 20/28/40 ms
檢查PC1和PC2的通信
PC>ping  192.168.2.2

Ping 192.168.2.2: 32 data bytes, Press Ctrl_C to break
Request timeout!
Request timeout!
Request timeout!
Request timeout!
Request timeout!

--- 192.168.2.2 ping statistics ---
  5 packet(s) transmitted
  0 packet(s) received
100.00% packet loss第二步:分別在SZ***和BJ***啓動TUNNEL接口
**SZ_*的配置
#
interface Tunnel0/0/1
 ip address 123.1.1.1 255.255.255.0
 tunnel-protocol gre
 source 172.16.12.1
 destination 101.1.1.1
#**BJ_*的配置
#
interface Tunnel0/0/1
 ip address 123.1.1.2 255.255.255.0
 tunnel-protocol gre
 source 101.1.1.1
 destination 202.1.1.1
#
NAT設備配置
#
interface GigabitEthernet0/0/1
nat static global 202.1.1.2 inside 172.16.12.1 netmask 255.255.255.255
#
第三步:配置引流路由
**SZ_*的配置
#
ip route-static 192.168.2.0 255.255.255.0 Tunnel0/0/1
#**BJ_*的配置
#
ip route-static 192.168.1.0 255.255.255.0 Tunnel0/0/1
#
第四步:檢查GRE隧道是否成功
**SZ_*的檢查
<SZ_***>display interface Tunnel 0/0/1
Tunnel0/0/1 current state : UP
Line protocol current state : UP
Last line protocol up time : 2020-02-26 18:10:00 UTC-08:00
Description:HUAWEI, AR Series, Tunnel0/0/1 Interface
Route Port,The Maximum Transmit Unit is 1500
Internet Address is 123.1.1.1/24
Encapsulation is TUNNEL, loopback not set
Tunnel source 172.16.12.1 (GigabitEthernet0/0/0), destination 101.1.1.1
Tunnel protocol/transport GRE/IP, key disabled
keepalive disabled
Checksumming of packets disabled
Current system time: 2020-02-26 18:23:31-08:00
    300 seconds input rate 0 bits/sec, 0 packets/sec
    300 seconds output rate 0 bits/sec, 0 packets/sec
    0 seconds input rate 0 bits/sec, 0 packets/sec
    0 seconds output rate 0 bits/sec, 0 packets/sec
    0 packets input,  0 bytes
    0 input error
    0 packets output,  0 bytes
    0 output error
    Input bandwidth utilization  : --
    Output bandwidth utilization : --

<SZ_***>**BJ_*的檢查
<BJ_***>display interface Tunnel 0/0/1
Tunnel0/0/1 current state : UP
Line protocol current state : UP
Last line protocol up time : 2020-02-26 18:11:02 UTC-08:00
Description:HUAWEI, AR Series, Tunnel0/0/1 Interface
Route Port,The Maximum Transmit Unit is 1500
Internet Address is 123.1.1.2/24
Encapsulation is TUNNEL, loopback not set
Tunnel source 101.1.1.1 (GigabitEthernet0/0/0), destination 202.1.1.2
Tunnel protocol/transport GRE/IP, key disabled
keepalive disabled
Checksumming of packets disabled
Current system time: 2020-02-26 18:24:07-08:00
    300 seconds input rate 0 bits/sec, 0 packets/sec
    300 seconds output rate 0 bits/sec, 0 packets/sec
    0 seconds input rate 0 bits/sec, 0 packets/sec
    0 seconds output rate 0 bits/sec, 0 packets/sec
    0 packets input,  0 bytes
    0 input error
    0 packets output,  0 bytes
    0 output error
    Input bandwidth utilization  : --
    Output bandwidth utilization : --

<BJ_***>
PC1訪問PC2
PC>ping 192.168.2.2

Ping 192.168.2.2: 32 data bytes, Press Ctrl_C to break
From 192.168.2.2: bytes=32 seq=1 ttl=126 time=78 ms
From 192.168.2.2: bytes=32 seq=2 ttl=126 time=94 ms
From 192.168.2.2: bytes=32 seq=3 ttl=126 time=94 ms
From 192.168.2.2: bytes=32 seq=4 ttl=126 time=78 ms
From 192.168.2.2: bytes=32 seq=5 ttl=126 time=109 ms

--- 192.168.2.2 ping statistics ---
  5 packet(s) transmitted
  5 packet(s) received
  0.00% packet loss
  round-trip min/avg/max = 78/90/109 ms

PC>